Bearish View
Sell the GBP/USD (bearish pennant pattern).
Add a take-profit at 1.3650 and stop-loss at 1.3950.
Timeline: 1-2 days.
Bullish View
Set a buy stop at 1.3900 (psychological level).
Add a take profit at 1.4000 and a stop-loss at 1.3800.
The GBP/USD is in a tight range as Forex traders continue watching the Treasury yields market ahead of the US inflation numbers. It is trading at 1.3843, which is slightly above yesterday’s low of 1.3778.
Dollar Rally Pauses
The GBP/USD pair declined slightly yesterday as investors reacted to the $1.9 trillion stimulus package that was passed by the Senate. The new bill will next move to the House of Representatives, where it will be passed swiftly and then moved to Biden’s desk. This package will provide more funding for vaccine rollout, stimulus checks, and funds for small businesses.
Economists believe that the record stimulus package will lead to a faster economic recovery since the US has already made a lot of progress on vaccinations. While a faster recovery is a good thing, it also welcomes a faster intervention by the Federal Reserve to prevent it from overheating. The bank could achieve this by tapering its asset purchases and raising interest rates earlier than expected.
There are signs that consumer inflation is rising in the US. The latest data showed that the Headline Consumer Price Index (CPI) increased by 1.4% in January. Tomorrow, the statistics agency will publish the February data.
Economists polled by Reuters expect the data to show that prices rose from 1.4% to 1.7% in February. They also see the Core CPI rising to 1.5%. These numbers mean that inflation is inching closer to the Fed’s target of 2.0%. As such, while the bank may not hike rates this year, officials will likely start talking about a return to normal.
The GBP/USD is a little changed because US yields have calmed a bit. The 10-year Treasury yield has dropped slightly to 1.572% while that of the 30-year and 5-year have fallen to 2.28% and 0.842%, respectively.
GBP/USD Technical Outlook
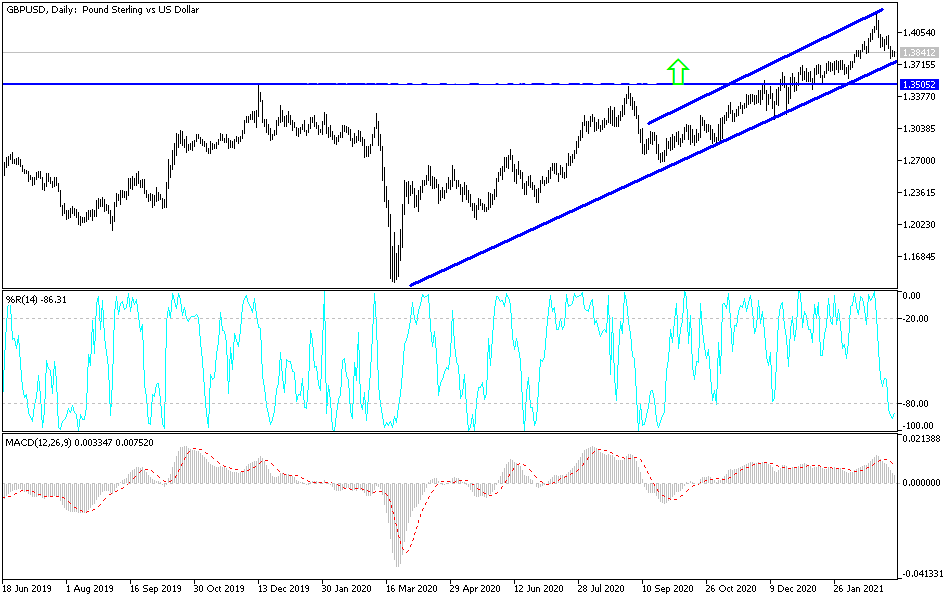
The GBP/USD is in a tight range today. On the four-hour chart, the pair has formed a bearish pennant pattern that is shown in purple. In technical analysis, this is usually a continuation pattern. The price is also slightly below the 15-period and 25-period exponential moving averages (EMA). Therefore, the pair will likely resume the downward trend as the pennant pattern nears its confluence zone. If this happens, the next key level to watch will be 1.3650.


