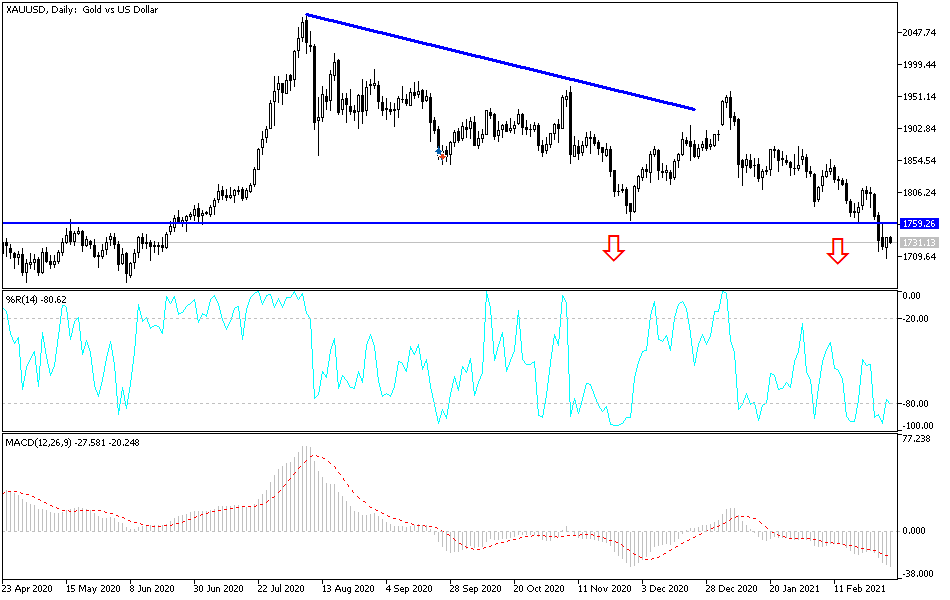
The gold markets initially fell during the course of the trading session on Tuesday to reach down towards the $1700 level. As a result, the market found buyers at this major support level. We ended up turning around to turn the daily candlestick into a hammer, which is preceded by a potential inverted hammer. This is a market that looks as if it is hanging about in the same $50 range, trying to decide whether or not we are going to continue to break down or if we are simply going to go higher.
If we do break above the $1750 level, then it is likely that the market could go looking towards the $1800 level, which would put the 200-day EMA into the picture as far as resistance. On the other hand, if we turn around and break down below the $1700 level, then it is likely that the market could go much lower, perhaps as low as the $1500 level. Remember, even though gold is a longer-term “buy-and-hold” type of situation, inflation comes into the picture as far as the longer-term trend.
The shape of the candlestick is bullish, but then again, you can say that the shape of the previous candlestick was bearish. It is because of this that I think we are trying to figure out where to go next, and we are at an area that in the past did see a lot of buying to break out and send the market much higher. However, I think we need to see yields in the United States drop significantly in order for people to get involved to the upside yet again. The US dollar sold off a bit during the trading session on Tuesday after initially rallying, and that is part of what you are seeing on this chart. I do not know that we have any type of definitive move in general quite yet, but at this point the market is sooner or later going to make a huge move. This is more of an investment than anything else, not necessarily short-term thinking. However, if you are a short-term trader, then the area between the $1700 level on the bottom and the $1750 level could offer a nice range-bound trading situation.


