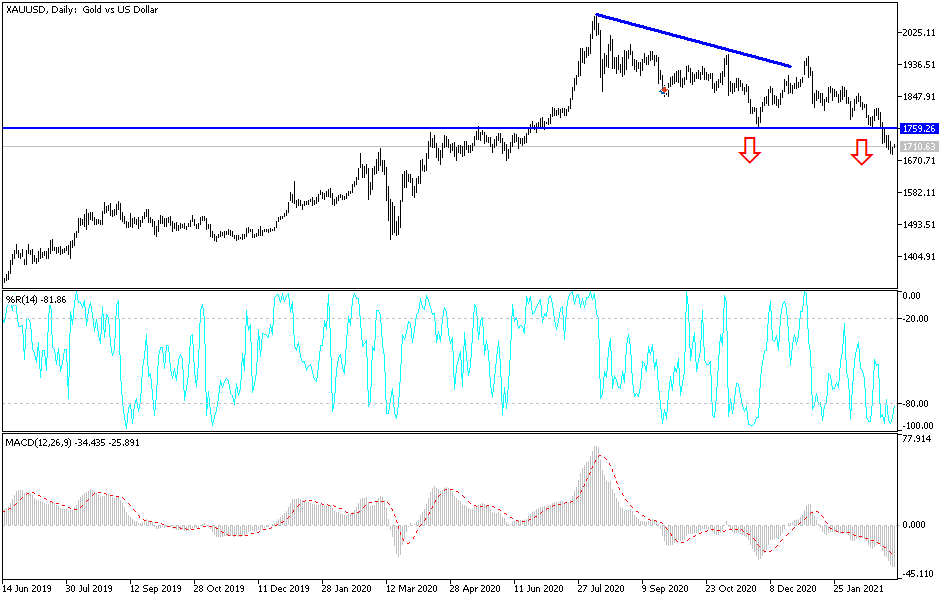
The sharp gains of the US dollar and Bitcoin contributed to the collapse of gold to the $1687 level last week before closing around $1701, its lowest close since early June 2020. Gold prices fell and yellow metal futures suffered their third consecutive weekly loss, with optimism about a rapid economic recovery growing on the back of booming US jobs data and the strong dollar that affected the commodity.
The US Federal Reserve Chairman's remarks that he expects some inflationary pressures in the future seems to have contributed little to the increase in the dollar and bond yields.
Powell said that the recent increase in bond yields was "remarkable" and that "turbulent conditions in financial markets" or a broad tightening of financial conditions would lead to a policy change. But he refrained from saying that recent market fluctuations meet those criteria. Accordingly, the US dollar continued its recent gains, as it rose to its highest level in 3 months, and the yield on 10-year US Treasury bonds rose to more than 1.6%, which reduced the demand for safe-haven assets such as gold.
Gold interacted with the announcement of the results of important economic data, which showed that the non-farm payrolls numbers in the United States for February exceeded the expected employment outcome of 182,000, with a figure of 379,000. The US unemployment rate for the month also decreased to 6.2% from 6.3% in January. The market did not expect any change from the previous month. On the other hand, average hourly wage growth beat the annual forecast of 5.1% by 5.3%, the same growth rate recorded in January.
Prior to that, it was reported that US jobless claims for the week ending February 26th had exceeded expectations of 750k, with a record 745k. The previous week's continuing claims came in at 4.295M, which was slightly better than the expected number of claims at 4.3M. On the other hand, January US factory orders beat expectations (monthly) at 2.1% with a change of 2.6%. The ISM Manufacturing PMI reading for February beat expectations while the ISM Services PMI came in below estimates.
Technical analysis of gold:
In the near term, and according to the performance on the hourly chart, it appears that the price of gold is trading within the formation of a sharp descending channel, which indicates significant bearish short-term momentum in market sentiment. Gold is still very close to the 14-hour RSI oversold levels. Accordingly, the bulls will target short-term profits around $1720 or higher at $1740. On the other hand, the bears will look to extend the current lows towards $1680 or less to $1660.
In the long term, and according to the performance on the daily chart, it appears that the price of gold is trading within a descending channel formation, which indicates a slight long-term bearish momentum in market sentiment. It has now exceeded oversold levels in the 14-day RSI. This can lead to a bounce at any time. Accordingly, the bulls will target profits for the long-term bounce at around 50% and 38.20% Fibonacci at $1,767 and $1837, respectively. On the other hand, the bears will be looking to target the 76.40% Fibonacci level at $1609 or lower at $1535.
The US dollar is not expecting any important economic data today, which may be a reason for the price of gold to find an opportunity to rebound.


