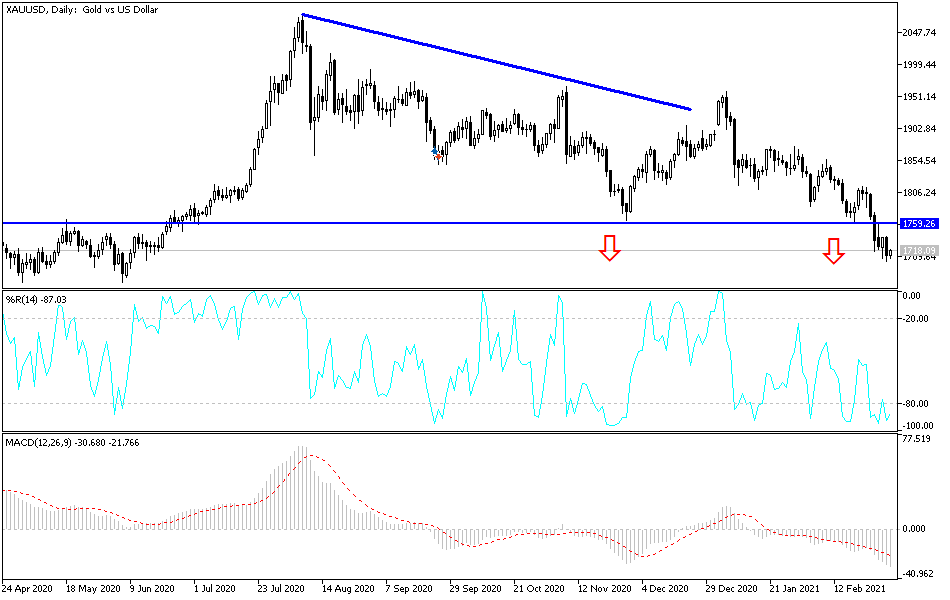
Since the start of trading this week, the price of gold has been in a continuous downward correction range. The pair fell to the $1702 support level before settling around $1720 in a new attempt not to cross the psychological support barrier of $1700, which may increase the bears' control over performance. The strength of the US dollar increases the weakness of gold. Gold's losses paused temporarily after the US released the ADP Non-Farrm Employment Change Index, which reported 117K jobs in February versus the 203K expected.
Gold's current losses pushed technical indicators into oversold areas. It can bounce up at any time.
The Fed's survey of business conditions across the US found that economic activity was growing at a modest pace in February. The Fed's survey released on Wednesday showed that the central bank's business contacts expressed optimism last month about a stronger recovery as more COVID-19 vaccines were distributed. Reports on consumer spending and auto sales were mixed, while overall manufacturing showed moderate gains despite supply-side constraints.
The report, known as the Beige Book, is based on opinion polls conducted by 12 regional banks for the Federal Reserve. It will form the basis for the discussions when central bank officials meet on March 16-17 to discuss their future moves on the monetary policy of the world's largest central bank.
The Fed is expected to keep its benchmark short-term interest rate at a record low of 0 to 0.25%. The central bank is also expected to indicate again that interest rates will not rise in the foreseeable future and that the current pace of $120 billion per month in bond purchases will also continue.
Technical analysis of gold:
The price of gold is approaching critical support. According to the performance on the 4-hour chart, gold is close to reaching the bottom line of the main channel again after it failed to return to the upside towards the pivotal $1755 level in its last attempt. The violent breakdown via the descending wedge support and below the 50% Fibonacci line confirmed a further decline at least until the falling line. The price has reached the downtrend line but we have no indication yet that gold may develop a bullish reversal.
In fact, selling pressure is high, and therefore, the price gold may fall below the support level of $1700 if the US Dollar Index moves up strongly in the last hours of this week's trading. The closest support levels for gold are currently $1697, $1680 and $1660. I still prefer to buy gold from every downside.
In contrast, gold is trading directly above a critical support area, and any false reversal or breakdown pattern with a significant split can indicate that the downtrend has ended and that the price of gold will develop another leg higher. On the other hand, decline and stability below the downtrend line and below the 61.8% retracement level indicates a larger, bearish corrective phase in the short to medium term.
Today's economic calendar:
The release of the UK Construction PMI reading and the retail sales and unemployment figures for the Eurozone are expected. Then, the US unemployment claims and the statements of Federal Reserve Chairman Jerome Powell.


