Bullish View
Buy the AUD/USD pair and set a take-profit at 0.7822 (38.2% retracement)
Set a stop loss at 0.7680 (neckline of the inverted head and shoulders).
Bearish View
Set a sell-stop at 0.7710 (61.8% retracement)
Add a take-profit at 0.7650 and a stop loss at 0.7800.
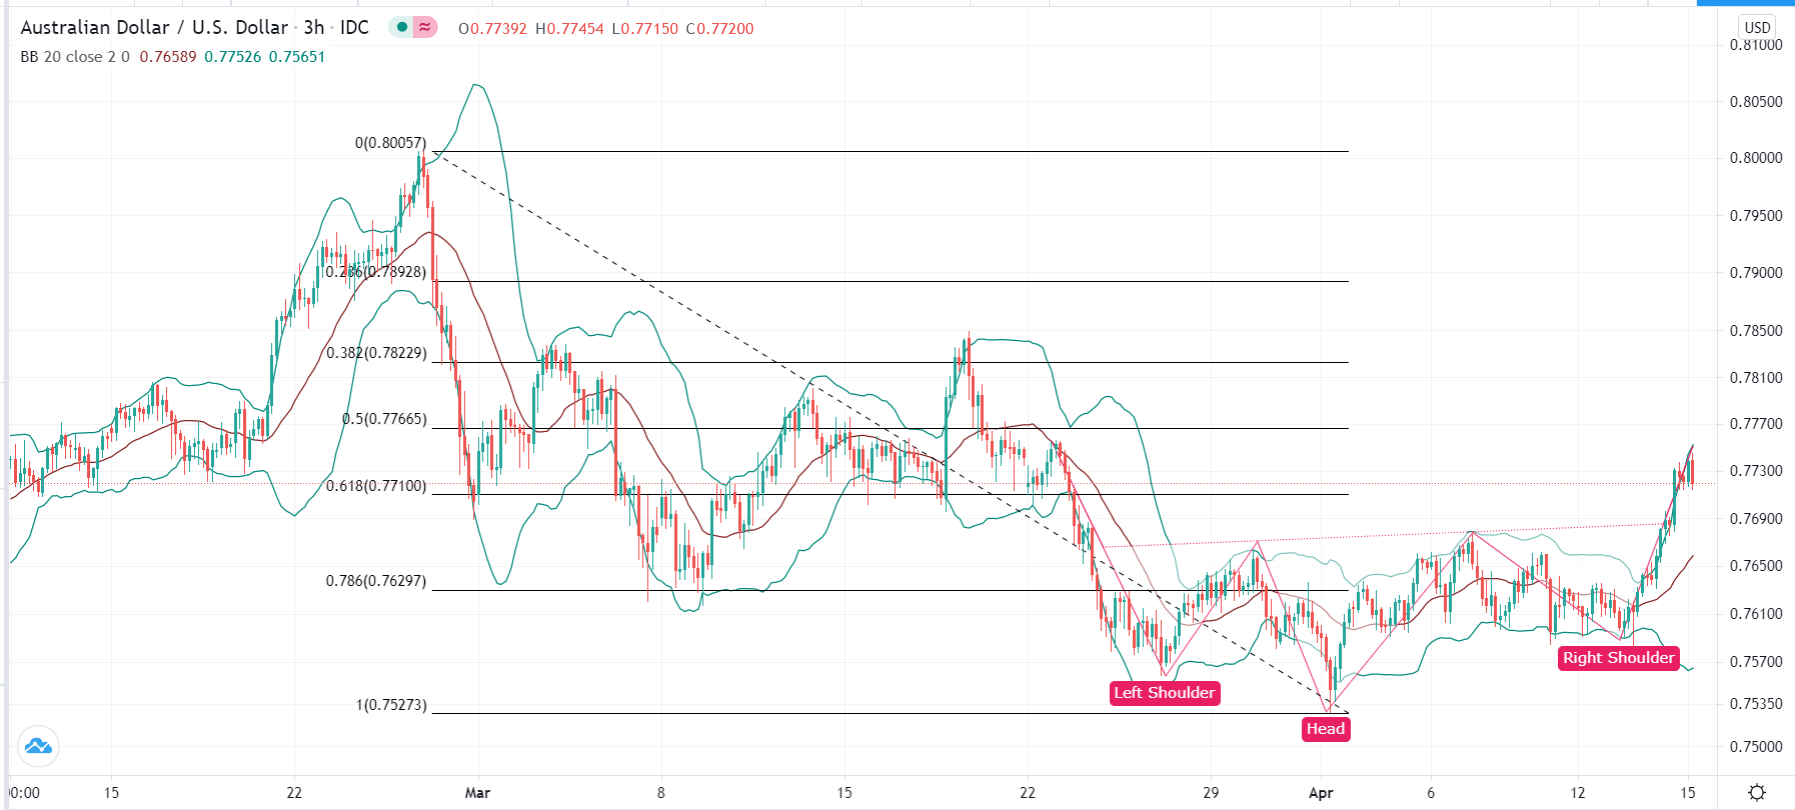
The AUD/USD pair jumped above the neckline of the inverted head and shoulders pattern after the strong US inflation and Australian jobs data. It is trading at 0.7745, which is the highest it has been since March 23.
Australian Jobs Data
The Australian economy is rebounding from its 2020 slump, as evidenced by the recent strong numbers. Last week, data from the country revealed that the Manufacturing and Services PMIs were strong in March.
Today, further data by the Bureau of Statistics, revealed that the labor market continued to do well. In total, the economy added more than 70.7k jobs in March after adding 88.7k in the previous month. This increase was a surprise since analysts were expecting the economy to add more than 35,000 jobs.
As the jobs increased, the unemployment rate dropped to 5.6% from the previous 5.8%. This decline was worse than the median estimate of 5.7%. It is also better than the US unemployment rate that stands at 6.0%. The participation rate, which measures the number of working-age people in the labour force, increased from 66.1% to 66.3%, respectively.
The AUD/USD has also held steady because of the recent US inflation numbers. On Tuesday, data revealed that the US headline inflation rose to 2.6%, which was above the Fed’s target of 2.0%. Nonetheless, analysts are not convinced that the Fed will change its mind on its easy money policy.
Later today, the AUD/USD pair will react to the latest US retail sales and initial jobless claims numbers. Analysts expect the data to reveal that the headline retail sales soared by 5.9% in March after sinking by 3% in February. They also see the core sales rising by 5%, helped by the recent stimulus package.
AUD/USD Technical Forecast
The AUD/USD pair rose to a high of 0.7750 after the strong Australian jobs numbers. This price is above 0.7680, which was the neckline of the inverted head and shoulder triangle pattern. On the three-hour chart, the pair has also moved above the 61.8% Fibonacci retracement level. It is also along the upper side of the Bollinger Bands indicator. The pair is also forming a bullish flag pattern. Therefore, the bullish trend will continue so long as the price is above the neckline at 0.7680. The next level to watch is the 50% retracement at 0.7766 and the 61.8% retracement at 0.7822.

