Bullish view
- Set a buy stop at 61,275 (yesterday high).
- Add a take-profit at 62,500 and a stop loss at 60,500.
Bearish view
- Set a sell-stop at 59,900 and a take-profit at 58,000.
- Add a stop-loss at 60,500.
The BTC/USD is hovering near its all-time high as the market focuses on the upcoming direct listing by Coinbase, the biggest crypto exchange in the US. It is trading at $60,956, which is slightly below the all-time high at close to $62,000.
Coinbase to become public
The Bitcoin price has found a substantial resistance slightly below its highest level on record ahead of the Coinbase direct listing.
Last week, the company reported impressive numbers, with revenue and the number of customers soaring. The firm has more than 56 million active users and more than 6.5 million monthly users. It made more than $1.8 billion in revenue and a net income of between $730 million and $800 million.
These numbers show that cryptocurrencies are indeed going mainstream. Just last week, Robinhood reported that it added more than 9.5 million cryptocurrency users in the first quarter. This was a bigger number than the 1.4 million who traded in the digital coins a quarter before. Robinhood, too, is expected to go public in the near term.
The Bitcoin price will also react to the latest US inflation numbers that will come out in the afternoon session. The numbers are expected to show that consumer prices surged by 2.5% in March because of the latest stimulus, the ongoing reopening, and the relatively higher oil prices.
Inflation numbers are important to cryptocurrencies because of their impact on the bond market and interest rates. If the inflation figure is higher than the median estimate, it could lead to higher bond yields and a stronger dollar as investors price in higher interest rates. In most times, the BTC/USD underperforms when the dollar strengthens.
BTC/USD Technical Forecast
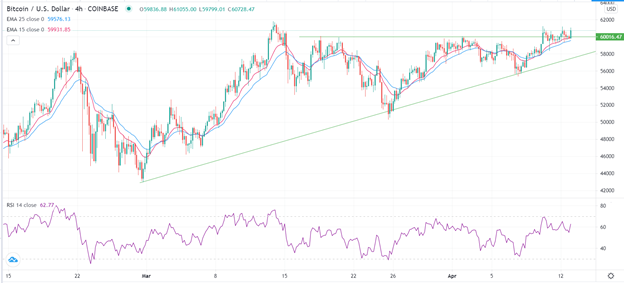
The BTC/USD pair has been in a tight range in the past few days as traders wait for the Coinbase IPO. It is trading at $60,956, which is slightly above the important resistance at $60,000. On the four-hour chart, it has also formed an ascending triangle pattern that is shown green. It is also above the 25-day and 15-day moving averages.
In technical analysis, an ascending triangle pattern is usually a bullish sign. The Relative Strength Index (RSI) has also moved close to the overbought zone. Therefore, the pair will likely break out higher in the near term as bulls attempt to move above the all-time high of 62,000. However, a drop below 58,000 will invalidate this prediction.


