Bearish View
- Set a sell-stop at 53,000 and a take-profit at 48,000.
- Add a stop-loss at 55,000.
- Timeline: 1 - 2 days.
Bullish View
- Set a buy stop at 58,300 and a take-profit at 60,000.
- Add a stop-loss at 56,000.
The BTC/USD price reacted mildly to the relatively dovish interest rate decision by the Federal Reserve. Bitcoin is trading at $54,497, which is 3.75% below its highest level yesterday and 16% above the lowest level last week. According to CoinMarketCap, the currency has a market cap of more than $1 trillion.
Fed Commits to Low-Interest Rates
To a large extent, the Federal Reserve has helped boost cryptocurrency and other asset prices in the past few months. That’s because, in its pandemic response, the bank decided to lower interest rates to a record low. It also started a major open-ended quantitative easing program, in which it is buying more Treasury bonds and mortgage-backed securities worth $120 billion per month. Therefore, when there is too much money flying around, all assets tends to attract attention.
Therefore, this week’s Fed meeting was important for Bitcoin and other digital currencies. This is because the market was mostly unsure about what to expect since the economy is firing on all cylinders. The top sectors like manufacturing and service are doing great while consumer spending has surged. Inflation has also moved above the Fed target of 2.0% while the unemployment rate is falling.
In its meeting, the bank decided to hold the tools steady. Rates will remain low and the asset purchases will continue. Most importantly, the bank said that it was not worried about inflation because it sees the recent jump as temporary.
The BTC/USD is also wavering even after more companies continued to buy the currency. This week, it was reported that Nexon had bought BTC worth $100 million. This is notable, since it is now the first known major Japanese company to buy the currency. As such, there are signs that other companies from the Asian region will buy the currency.
BTC/USD Forecast
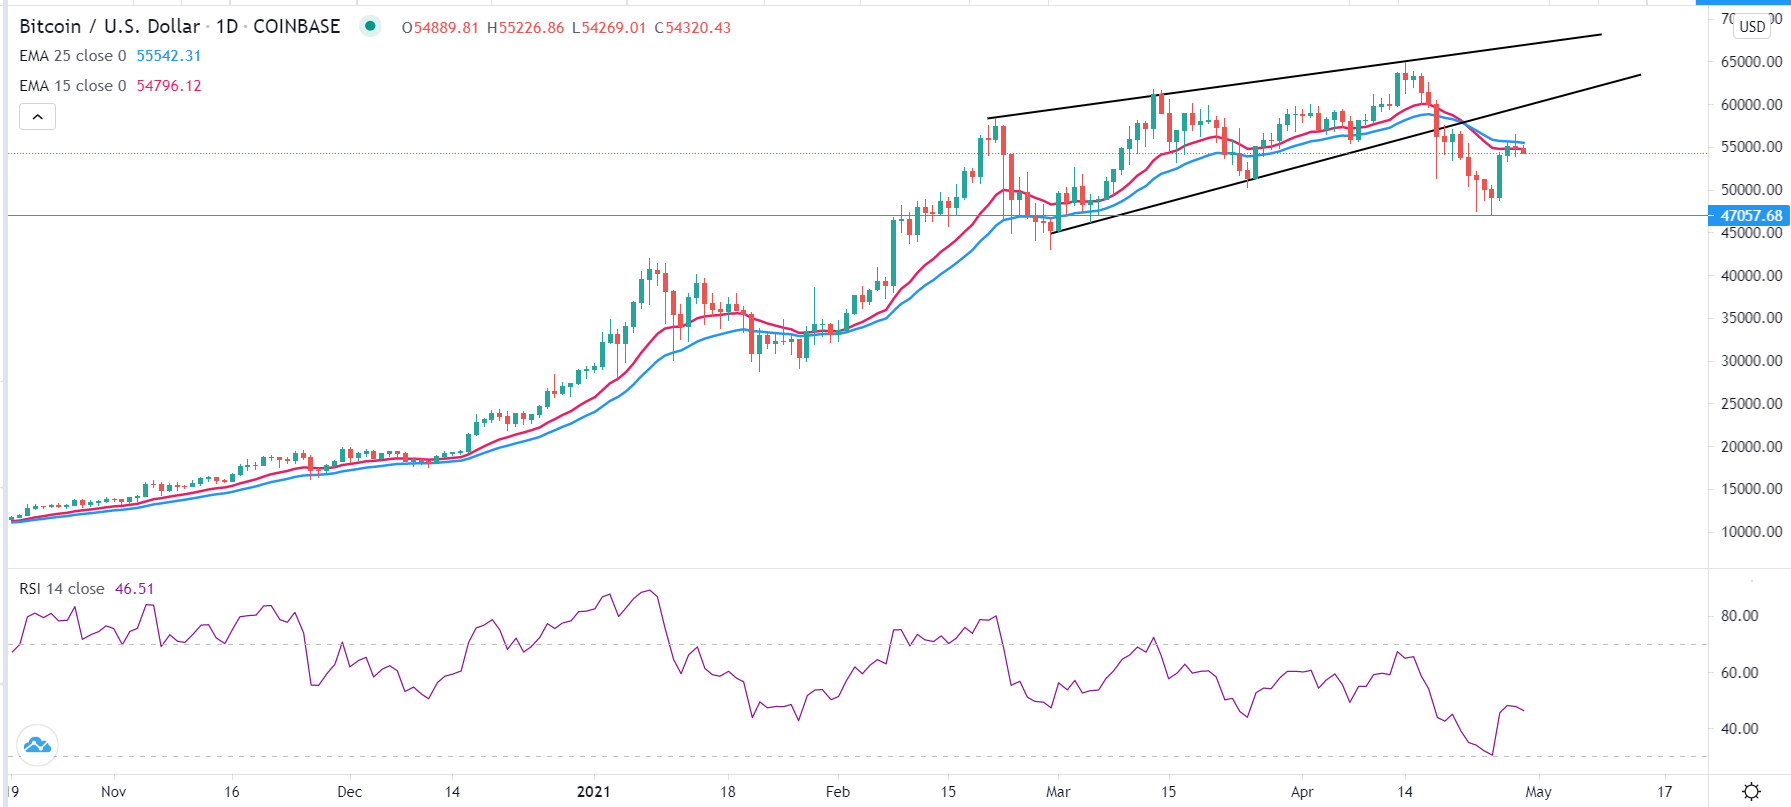
The daily chart below shows that the BTC/USD has been attempting to rebound lately. However, it has found some resistance slightly below the $55,000 level. This price is slightly below the lower side of the rising wedge pattern. It is also at the same level as the 25-day and 50-day exponential moving averages (EMA). The Relative Strength Index (RSI) has also remained at the neutral level of 40. Therefore, the pair could resume the downward trend as bears target last week’s low of $47,050.

