Bearish View
- Set a sell-stop at 49,500 and a take-profit at 47,000.
- Add a stop-loss at 53,000.
- Timeline: 1-2 days.
Bullish View
- Set a buy-stop at 55,743 and a take-profit at 58,000.
- Add a stop-loss at 53,000.
The BTC/USD pair is attempting a rebound a week after it crashed by more than 14,000 points. The Bitcoin price is trading at 53,520, which is 14% above its yesterday’s low of 47,000. According to CoinMarketCap, the currency has a market cap of almost a trillion dollars.
Bitcoin Attempts to Rebound
The past two weeks have been eventful for Bitcoin. The currency surged to an all-time high of $64,923 because of the enthusiasm about the Coinbase Global listing. As this euphoria waned, the currency crashed and moved below $47,000. This decline also pushed other digital currencies like Ethereum and Bimance Coin lower.
The Bitcoin price also declined because of the ongoing regulatory issues. Last week, Turkey announced that it would ban its citizens from owning the currencies. This happened at a time when the Turkish lira has been on a major decline. A few days later, two major exchanges with billions in assets went out of business.
The BTC/USD is gaining as investors rush to buy the dips. Historically, the price of Bitcoin tends to decline sharply after hitting a major milestone. This leads to more investors buying the dips, which pushes the prices higher. This is probably what is happening.
Further, the price is holding steady after Tesla published its first quarter earnings. The company announced that it had recognized a $272 million gain from its digital assets investments. In the statement, the company’s CEO reaffirmed its commitment to hold the digital currency in the long term.
BTC/USD Technical Forecast
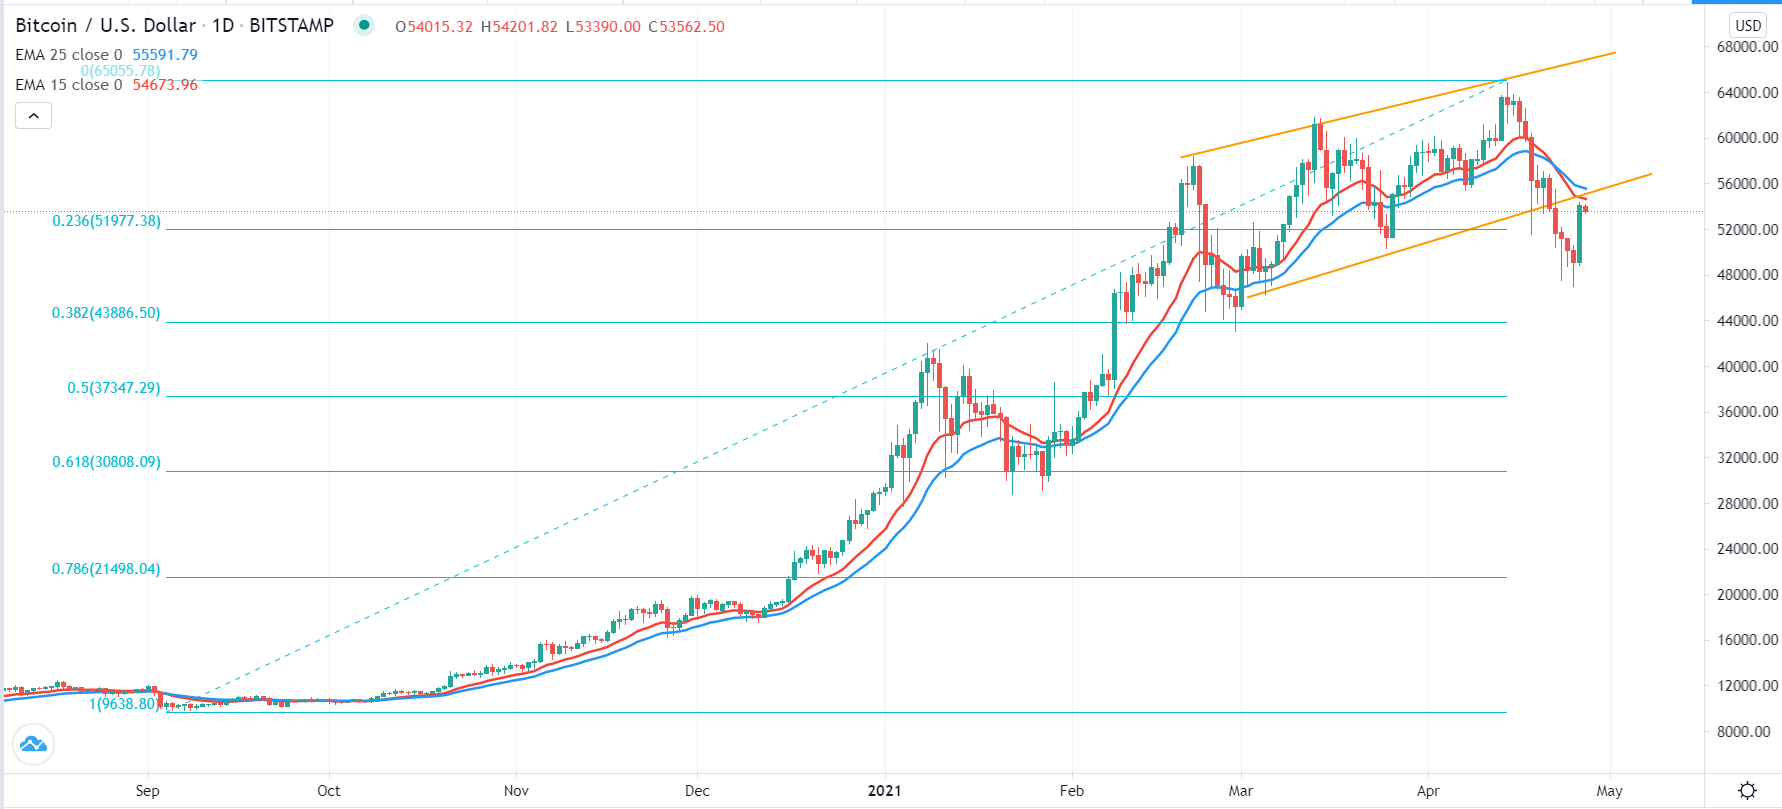
The daily chart below shows that the BTC/USD pair declined sharply in the past few days. Recently, though, the price has been in a strong upward trend as investors rush to buy the dips. The price has moved close to the ascending channel shown in orange. But it is still below the 25-day and 15-day exponential moving averages. Indeed, the two averages have made a bearish crossover pattern. It is also slightly above the 23.6% Fibonacci retracement level.
Therefore, this jump could be a dead cat bounce, meaning that the pair may resume the downward trend. If this happens, a move below yesterday’s low of 46,871 will see the Bitcoin price resuming the strong downward trend to the 38.2% Fibonacci retracement level at 43,866. This prediction will be invalidated if the price manages to move back to the ascending channel pattern.

