Bearish View
Set a sell-stop at 1.1940 and a take-profit at 1.1900 (slightly below the 61.8% retracement).
Add a stop loss at 1.200.
Timeline: 1 day.
Bullish View
Buy the EUR/USD and set a take-profit at 1.2037 (38.2% Fibonacci retracement).
Set a stop-loss at 1.1900.
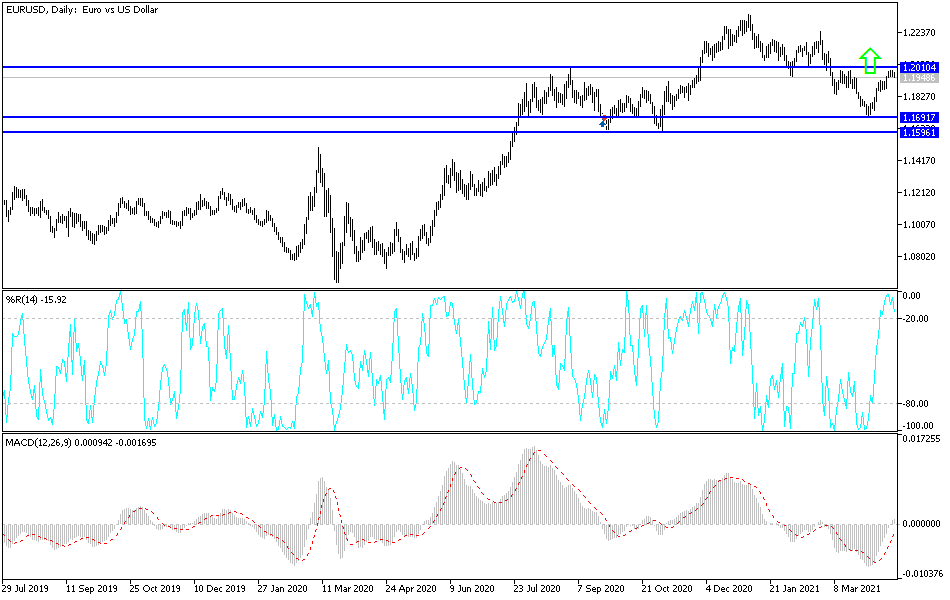
The EUR/USD price is tilting lower after it rose by more than 1% last week. The pair is trading at 1.1951, which is slightly below last week’s high of 1.1995.
ECB in Focus this Week
The EUR/USD had an eventful week last week. On Tuesday, the United States published strong consumer inflation numbers. The data revealed that the headline CPI rose by 2.6% year-on-year mostly because of the stimulus package, reopening and higher gasoline prices.
These numbers were followed by the strong US retail sales that were published on Thursday. The data also showed that spending jumped sharply in March as Americans increased their spending because of the stimulus.
Further data revealed that the number of Americans who applied for initial jobless claims fell to lower than 600,000 for the first time since the pandemic started. New York and Philadelphia manufacturing activity also rebounded. While all these numbers were strong, the US dollar and bond yields retreated because the market believes that the jump is temporary.
This week, focus will be on Thursday, when the European Central Bank (ECB) will deliver its April interest rate decision. Economists expect that the bank will leave interest rates unchanged as it continues to support the overall recovery. It will also not tweak the size of the large quantitative easing program. Furthermore, the bloc is still lagging behind other countries in its vaccination drive.
The EUR/USD will also be affected by this week’s flash Manufacturing and Service PMI numbers by Markit. Economists expect the Eurozone’s Manufacturing and Service PMIs declined from 62.5 to 62.0 and from 49.6 to 49.1, respectively. In the United States, the two numbers are expected to rise to 60.5 and 61.7, respectively.
EUR/USD Technical Outlook
The four-hour chart shows that the EUR/USD pair formed a double-top pattern at 1.1993 last week. This price was a few points above the 50% Fibonacci retracement level. Also, the pair has formed an ascending channel, and is currently slightly above the lower side. It has also moved slightly below the 25-day and 15-day exponential moving averages (EMA) while the Relative Strength Index (RSI) has moved below the overbought level.
Therefore, the downward momentum will be confirmed if the pair manages to move below the lower side of the channel. If this happens, the next key level to watch will be 1.1900. The other scenario is where the pair rebounds and retests the upper side of the channel.


