Bearish Signal
Sell the EUR/USD and add a take-profit at 1.1845 (50% retracement).
Add a stop-loss at 1.1910 (right shoulder).
Bullish Signal
Set a buy stop at 1.1910 and a take-profit at 1.2000.
Add a stop-loss at 1.1850.
The EUR/USD declined slightly as traders refocused on the US inflation numbers set to be released on Tuesday and the rising coronavirus cases in some US states. It is trading at 1.1890, which is slightly below last Friday’s high of 1.1910.
US Inflation Numbers in Focus
The economic calendar will have no major events from the United States today. Therefore, the market will focus on the latest US Consumer Price Index (CPI) data scheduled for tomorrow. Analysts expect that the overall CPI rose by 2.5% in March after rising by 1.7% in February. They also expect the core CPI rose by 1.6%.
This increase will be attributed to the $1.9 trillion stimulus package that was passed in March and the ongoing economic recovery in the United States. Furthermore, more states have already started to reopen while the unemployment rate has dropped to 6.0%. Also, the rising crude oil price contributed to the Consumer Price Index.
While the 2.5% headline CPI is above the Fed’s target of 2.0%, the bank will likely not shift its pandemic-response strategy. Indeed, in an interview during the weekend, Jerome Powell, the Federal Reserve chair warned that while the US economy was recovering, the rising coronavirus cases was a major concern.
The EUR/USD will today react to the latest EU retail sales numbers. Economists called by Reuters expect the bloc’s retail sales numbers rose by 1.5% in February after falling by 5.9% in January as countries implemented more lockdowns. They also see the sales falling by 5.4% year-on-year. The pair will also react mildly to the latest German Wholesale Price Index (WPI) that will come out in the morning session.
EUR/USD Technical Forecast
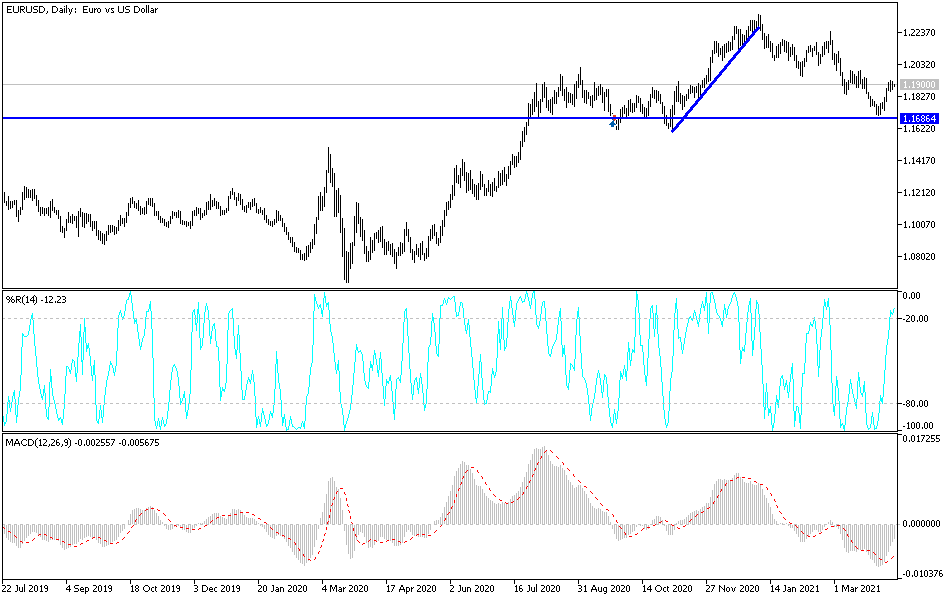
The EUR/USD pair rose to a high of 1.1928 last week. It then erased some of those gains and is now trading at 1.1892, which is slightly above the 38.2% Fibonacci retracement level. It is also at the same level as the 25-day and 15-day exponential moving averages (EMA).
Notably, the pair has also formed a head and shoulders pattern, which is usually a bearish signal. Therefore, the pair may keep falling as bears target the 50% retracement level at 1.1845. On the flip side, a move above the right shoulder at 1.1910 will invalidate this prediction.


