Bearish View
Set a sell limit at 1.1895 (upper side of descending channel).
Add a take-profit at 1.1690 (lower side of the channel.
Set a stop loss at 1.1944 (23.6% Fibonacci level).
Timeline: 2-3 days.
Bullish View
Set a buy stop at 1.1944 and a take-profit at 1.2050.
Add a stop-loss at 1.1900.
The EUR/USD price rally continued in the Asian session ahead of the European Services PMI numbers and FOMC minutes. The pair also rose as traders reflected on the American bond market as talks on the $2.3 trillion infrastructure package takes shape. It is trading at 1.1868, which is about 1.45% above the lowest level this year.
Services PMIs Ahead
Last week, Markit published the relatively strong Manufacturing PMI numbers from Europe and the US. The numbers showed that the sector continued to recover in March as demand and optimism rose.
Today, the company and its partners will publish the important Services PMI numbers from Europe. This is notable since the sector is the biggest employer in Europe. It has also been among the worst affected by the pandemic.
In the Eurozone, analysts polled by Reuters expect the data to show that the Services PMI increased from 45.7 in February to 48.8 in March. In Germany and France, the PMI is expected to rise to 50.8 and 49.5, respectively.
The EUR/USD also rose after the latest IMF global growth forecast. In a report yesterday, the IMF said that the global economy will rebound by 6.6% this year after slumping by 3.3% in 2020. This growth will be helped by the $16 trillion worth of government aid and the ongoing vaccination drive.
Later today, the Federal Reserve will publish the minutes of the last meeting. These minutes will show the thinking behind the bank’s recent monetary policy. In the meeting, it left interest rates and the quantitative easing policy unchanged. It also expressed concerns about the uneven state of the American economic recovery.
EUR/USD Technical Signals
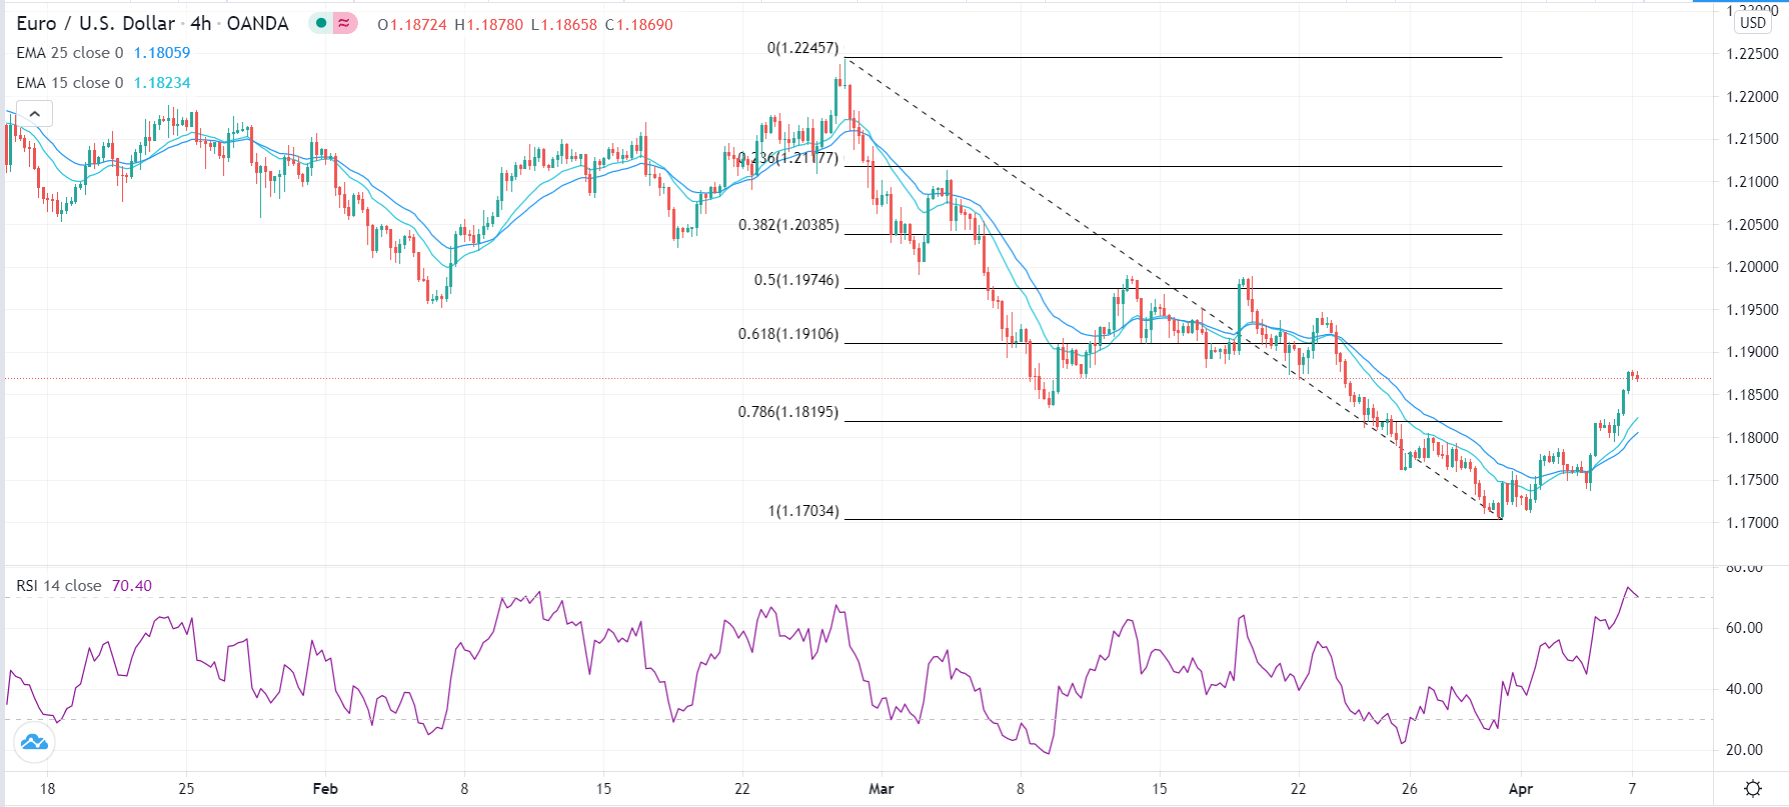
The four-hour chart shows that the EUR/USD pair has bounced back lately. It has managed to move above the 78.6% Fibonacci retracement level at 1.1820. Similarly, the 14-day and 28-day EMAs have made a bullish crossover. The Relative Strength Index (RSI) is also rising and is now at the overbought level.
Meanwhile, on the daily chart, the pair has bounced back after it tested the 38.2% retracement level at 1.1945. Also, it has moved to the upper side of the descending channel.
Therefore, while the pair may keep rising today, there is a possibility that it will retreat as bears target the 50% Fibonacci retracement on the daily chart at 1.1495 in the medium-term.


