Bullish View
Set a buy stop at 1.1917 (50% retracement).
Add a take-profit at 1.2035 (61.8% retracement).
Set a stop-loss at 1.1927.
Bearish View
Set a sell-stop at 1.1927 (upper side of the bullish flag).
Add a take-profit at 1.1850 and a stop-loss at 1.200.
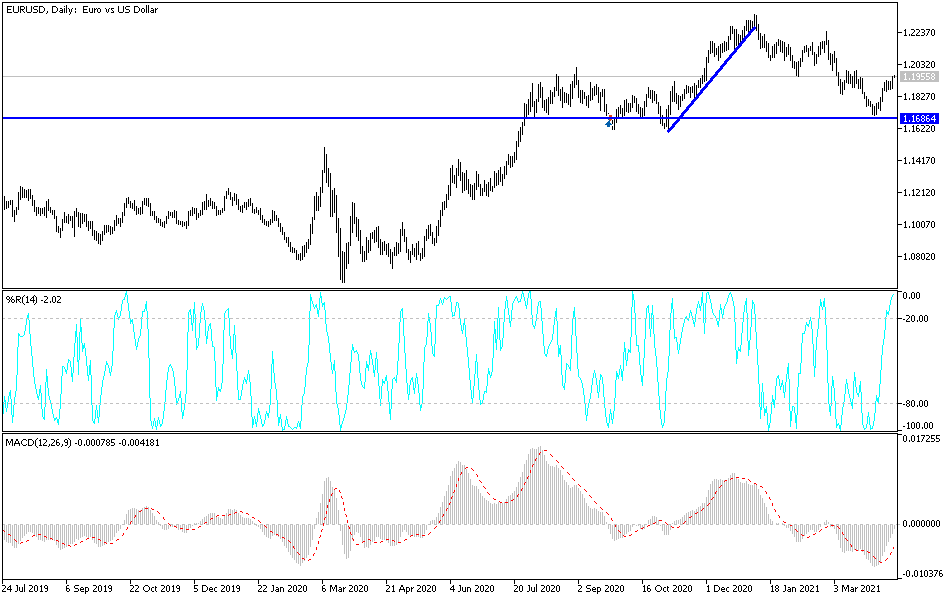
The EUR/USD price rallied to the highest level since March after the latest US consumer inflation numbers. It is trading at 1.1960, which is 2.2% above this month’s high of 1.1700.
US Consumer Prices Rose
Consumer inflation in the United States rose sharply, according to the latest data by the Labor Department. The headline Consumer Price Index (CPI) rose by 2.6% year-on-year led by higher gas prices. That was the biggest increase since August 2018. Gas prices rose by 9.1% because of the recent rally in crude oil prices. Core CPI that excludes food and energy rose by 1.6% as services prices rose.
The robust prices were above the Fed’s target of 2.0%. However, the market is unfazed because it views the causes of inflation as being temporary. For one, after rising to $70, the price of crude oil has dropped to the current $64 per barrel.
Also, the impact of the recent $1.9 trillion stimulus package will start to ease while the ongoing supply challenges will also ease as the economy reopens. Therefore, bond yields dropped after the data came out, with the 10-year falling to 1.62% and the 30-year falling to 2.30%.
Today, the EUR/USD will react to the latest Eurozone industrial production numbers. Analysts expect these numbers to show that production declined by 0.9% year-on-year in February after rising by 0.1% in the previous month. Other key numbers from Europe will be the Spanish and Swedish CPI.
The pair will also react to the first comments by Jerome Powell after the inflation numbers came out. The US will also publish the latest Import and Export Price Index a day before it releases the retail sales numbers.
EUR/USD Technical Forecast
On the four-hour chart, we see that the EUR/USD had a bullish breakout yesterday. By doing this, the price moved above the upper side of the descending channel shown in blue. It also moved above the important bullish flag pattern shown in black. It is now approaching the 50% Fibonacci retracement level and is being supported by the 25-day and 15-day moving averages.
Therefore, the bullish trend will likely continue if bulls manage to cross the 50% retracement level. If this happens, the next key target is the 28.2% retracement at 1.2035.


