Bullish View
Set a buy-stop at 1.4010 and a take-profit at 1.4065.
Add a stop-loss at 1.3950.
Timeline: 1 day.
Bearish View
Set a sell-stop at 1.3950.
Add a take-profit at 1.3870 and a stop-loss at 1.4000.
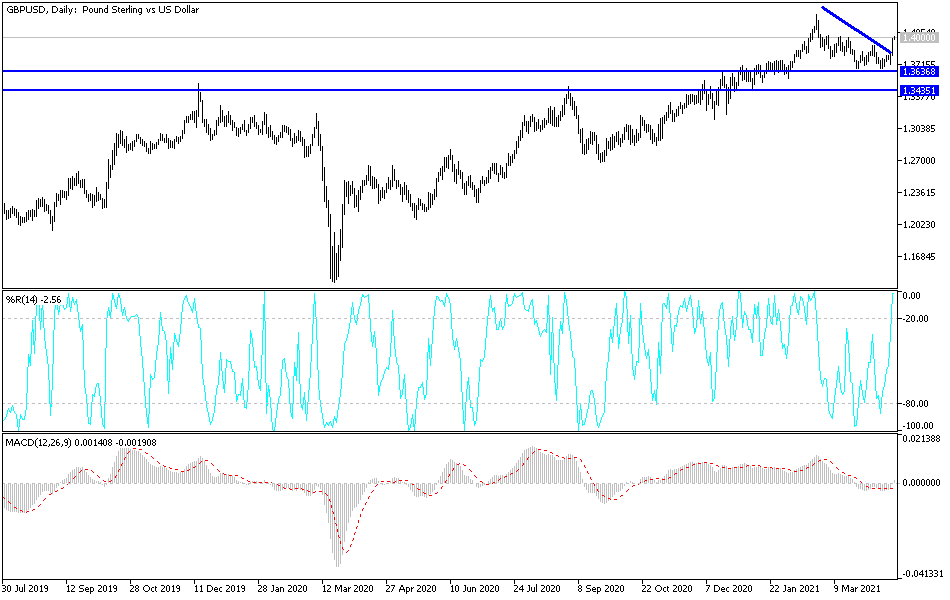
The GBP/USD soared to the highest level since March 18 as the dollar sell-off accelerated. The pair is trading at 1.400, which is 2% above the lowest level on Friday last week.
UK Jobs Numbers in Focus
The GBP/USD rose sharply on Monday after the US dollar crashed. The US Dollar Index dropped by more than 0.80%, the worst decline since March as the market focused on the bond yields. It dropped against most developed country currencies like the Japanese yen, Swiss franc and the euro.
This performance came at a time when the recent economic numbers have been supportive of the currency. Data released this month showed that US Manufacturing and Non-Manufacturing PMIs continued to rally.
Numbers also showed that the labour market was tightening while inflation rose to the highest level in almost eight years. Retail sales also surged by almost 10% because of the recent stimulus.
While these numbers have been strong, the market is convinced that the Federal Reserve will not hike interest rates or turn bullish any time soon. This is evidenced by the performance of the bond market. The 10-year bond yield rose by 0.80% to 1.61% while the 2-year rose by 1.37% to 0.16%. While the yields are slightly above the lowest level yesterday, they are substantially below their highest level this year.
The GBP/USD will today react to the latest UK jobs numbers. Economists polled by Reuters expect the data to reveal that the unemployment rate rose from 5.0% to 5.1%. However, analysts have been consistently wrong about the UK unemployment forecast. As such, there is a possibility that it will drop below 5.0% for the first time in months. The Office of National Statistics (ONS) will also publish the claimant count, jobs added, and wage growth numbers.
GBP/USD Technical Forecast
The GBP/USD pair rallied to the important psychological level of 1.400 yesterday. On the hourly chart, the pair moved above the important resistance at 1.3918, which was the highest point on April 6. As a result, the pair moved above the short and longer-term moving averages. It also moved above the VWAP indicator. Most importantly, it has formed a bullish flag pattern that is shown in red. Therefore, the pair may break out higher as bulls target the next key resistance at 1.4050. However, we should also not rule out a major pullback as some bulls take profit.

