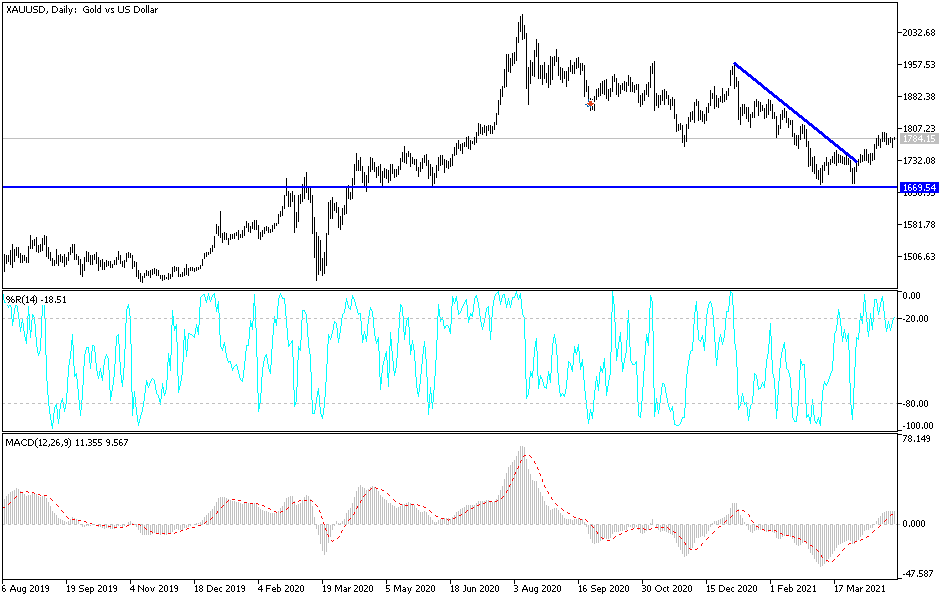
Gold markets initially fell during the trading session on Wednesday to reach down towards the 50-day EMA. We have since bounced from there, as the FOMC meeting has come and gone. At this point, the market looks as if it is trying to reach to the upside, perhaps reaching towards the 200-day EMA, which is currently at the $1792 level. If we can break that area, then it would obviously be a very bullish sign. However, I would not become overly bullish of gold until we clear the $1800 level on a daily close.
To the downside, if we break down below the 50-day EMA, then I believe that the market is going to go looking towards the $1725 level. That is an area where we had seen quite a bit of buying recently, but breaking down below there then opens up a move down to that little double bottom that we see on the chart. That currently is sitting at the $1675 level, and if we can break down below there, then it is very likely that we will open up a huge move lower, perhaps down to the $1500 level.
This is a difficult market to trade right now, because interest rates are continuing to climb, and that does not help gold as you can make quite a bit more money simply clipping coupons in the bond market than you will trying to hang onto gold and, worse yet, paying for storage. Keep in mind that retail traders do not move this market, but people who buy actual physical gold will at times have a huge influence, and clearly, they do not want to pay for the storage right now. That being said, if the US dollar gets hammered significantly, that could drive gold higher in and of itself. We certainly look like a market that is ready to see a bit of a push higher, but it is not until we get that daily close above the $1800 level that I think you could be much more comfortable going long. In the short term, I would not be surprised at all to see the market continue to undulate between the 50-day EMA on the bottom and the 200-day EMA on the top.


