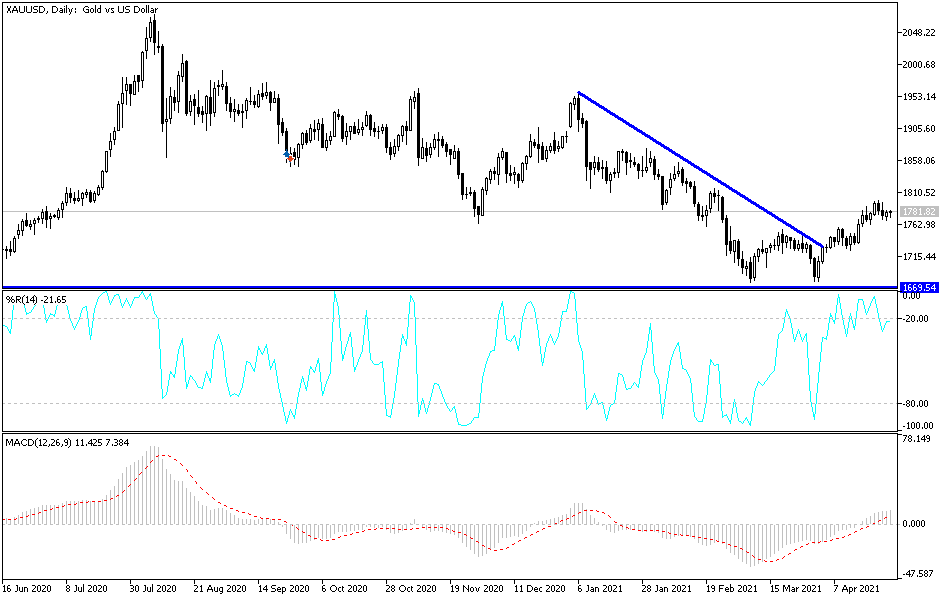
Gold markets have initially fallen during the trading session on Monday to reach down towards the 50-day EMA. With that being the case, the market continues to see at least a rudimentary amount of support. However, just above current pricing, we have the 200-day EMA that sits at the $1793 level. That is a significant resistance barrier, one that extends to the $1800 level. In fact, it is not until we break above the $1800 level that I would consider that violated.
When you look at the chart, you can see that we had originally broken much higher but are still very much in a huge swing lower. When you also look at the overall situation when it comes to gold, the market is highly levered to the yield of bonds in America, so I think you need to be very cautious about trying to go against rising or falling yields.
If we were to break above the $1800 level, then I think it is likely that the gold market will go looking towards the $1850 level, possibly even the $1950 level after that. However, if we turn around and break down below the red 50-day EMA underneath, that opens up an attack on $1750 level, possibly even a drop down towards the double bottom at the bottom of the most recent downtrend. If that gets violated, then it is likely that we will go reaching towards the $1500 level.
Gold is not behaving like a “safe haven”, and that should not be a huge surprise considering that everyone is trading the “reopening trade”, and although a lot of retail traders are taught that gold is a hedge against inflation, that is only when yields are rising in the bond market, as there is much more safety in bonds since you can just simply clip the coupon instead of worrying about the fluctuation in price so much.
Only time will tell where we go next, but you could make a bit of an argument for a bullish flag, so it is possible that we could see the buyers finally overcome all of this negativity. Ultimately, I am using these two moving averages as a signal as to which direction I should be trading once we finally do get that move.


