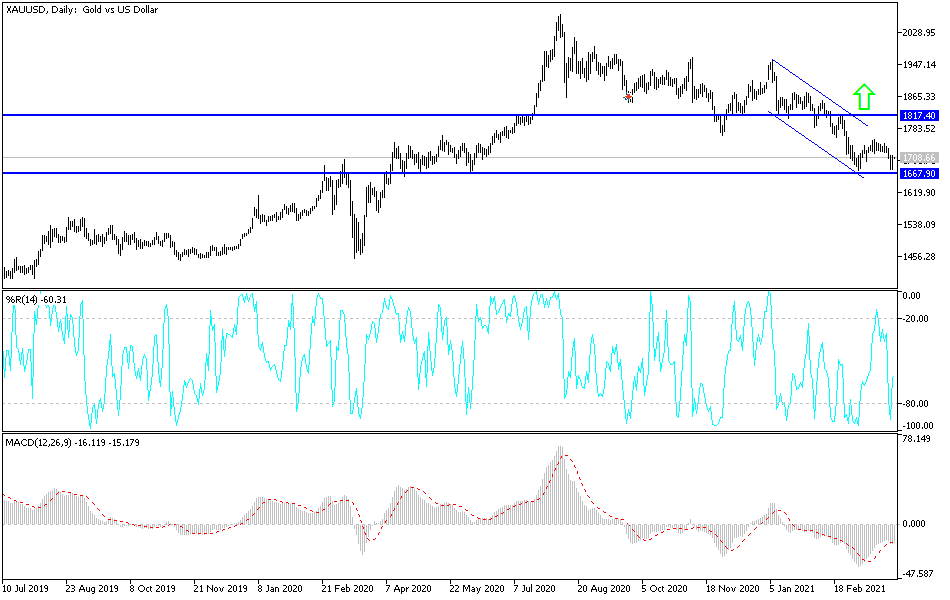
After the bears pushed the price of gold to the $1678 support level during yesterday's trading, gold has returned to settle around $1713 as of this writing. The price of gold remained under pressure as commodity investors awaited details about the important infrastructure plan from US President Joe Biden, which could lead to another shock to the US economy, which suffers from the effects of the coronavirus pandemic.
Before Joe Biden's announcement, a private sector report from ADP showed that the United States added 517,000 jobs in March, marking the largest gain in six months as a drop in coronavirus cases enabled companies to reopen or extend business hours.
The ADP report indicates that the government report due tomorrow will be a solid one.
The private sector report provides additional evidence of the strengthening of the US economy that is being supported by a massive $1.9 trillion federal aid package and the rollout of COVID vaccines.
FactSet data showed that gold fell 2.6% and lost nearly 11% in the first three months of 2021. Silver fell nearly 9% in March and abandoned that amount in the first quarter. The strength of the US dollar was a major factor in the decline in precious metals. The US Dollar Index (DXY) rose 3.7% in the first quarter. A stronger dollar could make dollar-priced assets relatively more expensive for overseas buyers. Adding to the pressure on gold, US Treasury yields rose to their highest level in 14 months, above 1.76%.
Gold Technical Analysis:
In the near term, and according to the performance on the hourly chart, it appears that the price of gold has rebounded lately after its bearish breakdown. Gold has since rallied to trade in an overbought region for the 14-hour RSI. This could lead to a short-term downturn.
Accordingly, the bulls will be looking to ride the current bounce by targeting profits at around $1720 or higher at $1740. On the other hand, the bears will be targeting short-term profits of around $1695 or less at $1677.
In the long term, and according to the performance on the daily chart, it appears that the price of gold is trading within a downward channel formation. It has now dipped below the 100-day and 200-day simple moving average lines. It also appears to be nearing oversold levels in the 14-day RSI. Therefore, the bears will look to extend the current downtrend towards the 76.40% Fibonacci level at $1609 an ounce or less to $1535 an ounce. On the other hand, the bulls will target long-term gains at around 50% and the 38.20% Fibonacci retracement level of $1,767 and $1,838 respectively.

