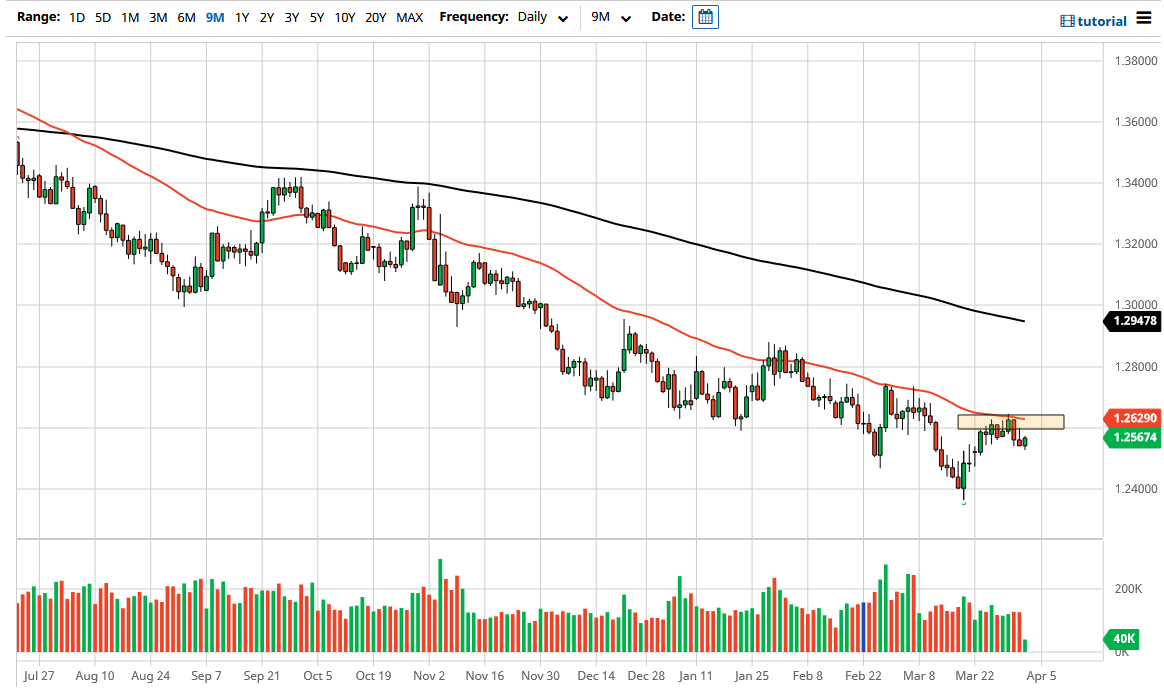
The US dollar has rallied slightly during the trading session on Good Friday, as bankers were away for the holiday. That being said, the market is likely to see a lot of noise in this general vicinity as we continue to see oil jump back and forth. At this point in time, the technical indicators for the USD/CAD pair continues to favor the downside, although we did in fact trying to turn things around on Friday.
Part of this would have been due to the fact that yields in America continue to rise, thereby making the differential between American and Canadian bonds favor the US. However, I see significant resistance above at the 1.2630 level, as it is where we recently pulled back from, and also has the 50 day EMA attached to it. At this point, I think that signs of exhaustion will probably be sold into, but if we were to break above that level, I think that the pair could go looking towards the 1.27 level, and then eventually the 1.28 level. However, the reality is that we have been in a downtrend for quite some time, so it still going to be easier to fall than rise.
To the downside, I believe that the 1.24 level probably causes a bit of support and perhaps could be a target again. If we break down below there, then we have a few other minor areas underneath that come into play as support, but it should be noted that on the monthly chart we are getting dangerously close to major support, we just are not there quite yet. This pair obviously has quite a bit of influence thrown at it from the crude oil markets, which has recently seen the OPEC announcement that they are in fact going to gradually increase production.
Now the question is whether or not the United States can lift the rest of the world out of the global slowdown, as the country added 916,000 jobs for the month of March. With that being the case, I think that the Monday candlestick will be crucial, and I look at it as a move below the last couple of days as a selling opportunity, or if we break above the 50 day EMA then it is a buying opportunity.


