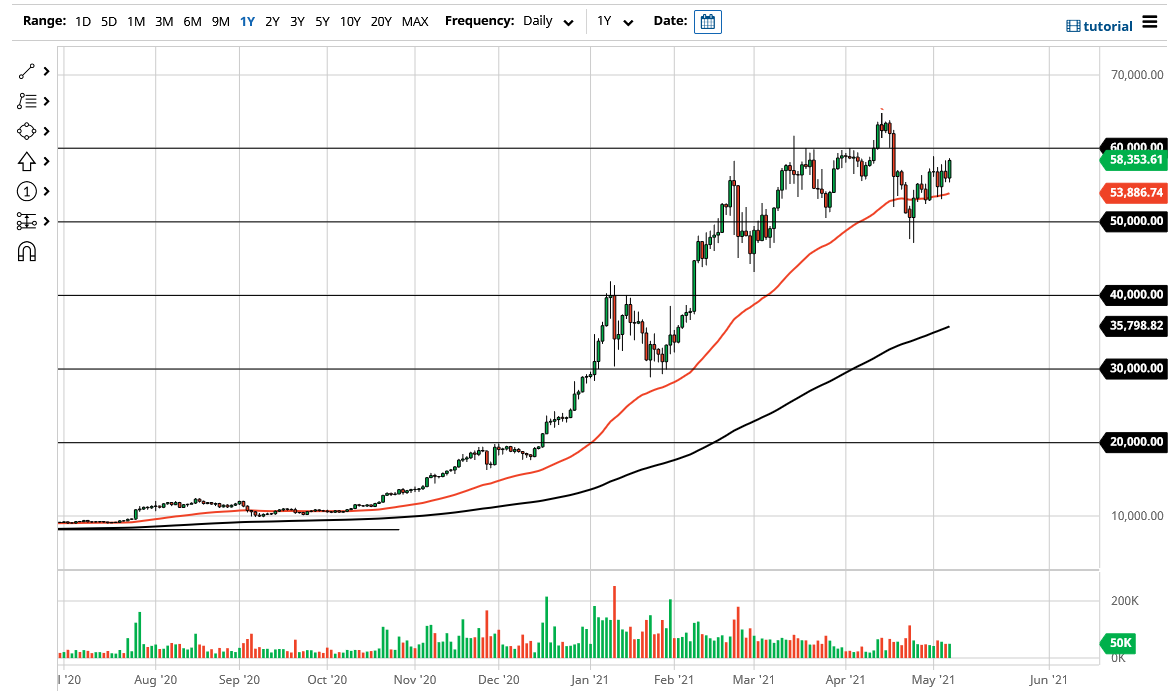
The Bitcoin market saw bullish pressure during the trading session on Friday to end the week, as the jobs number came out at just 266,000 jobs added for the month of April, much lower than the consensus of 1 million. Looking at the chart, you can see that we are closing towards the top of the candlestick, which suggests that we could get a little bit of follow-through. What I also find very interesting is the fact that we are closing towards the top of the previous shooting star, suggesting that we are going to break through a significant amount of short-term selling pressure.
Just above, we have the $60,000 level offering resistance, from both a structural and a psychological standpoint. That being said, the market has broken above there previously, so it is not as if it would be monumental to get above there. The 50-day EMA underneath has offered support over the last couple weeks, and I still think it continues to be a factor. This is a market that you cannot short, because it will continue to see buyers every time there is a dip.
I believe that there is a significant amount of support underneath at the $50,000 level, where we have seen a couple of hammers form recently. Furthermore, the $50,000 level is an area that has a lot of psychology attached to it, so I would be a bit surprised to see this market break down through there. If it did, then we more than likely will go looking towards the 200-day EMA, which is going to be racing towards the $40,000 level. With that, I think there would be a lot of value hunters getting involved, as we are obviously in an uptrend.
If we were to break above the $65,000 level, it is likely that the market will go looking towards the $70,000 level at the very least, perhaps even extend towards the $75,000 level. Bitcoin continues to be very volatile, but when you look at the chart there is an obvious slant from the “lower left to the upper right.” I have no idea in which direction I am going to be shorting this market, so at this point I am not even looking for that set up.

