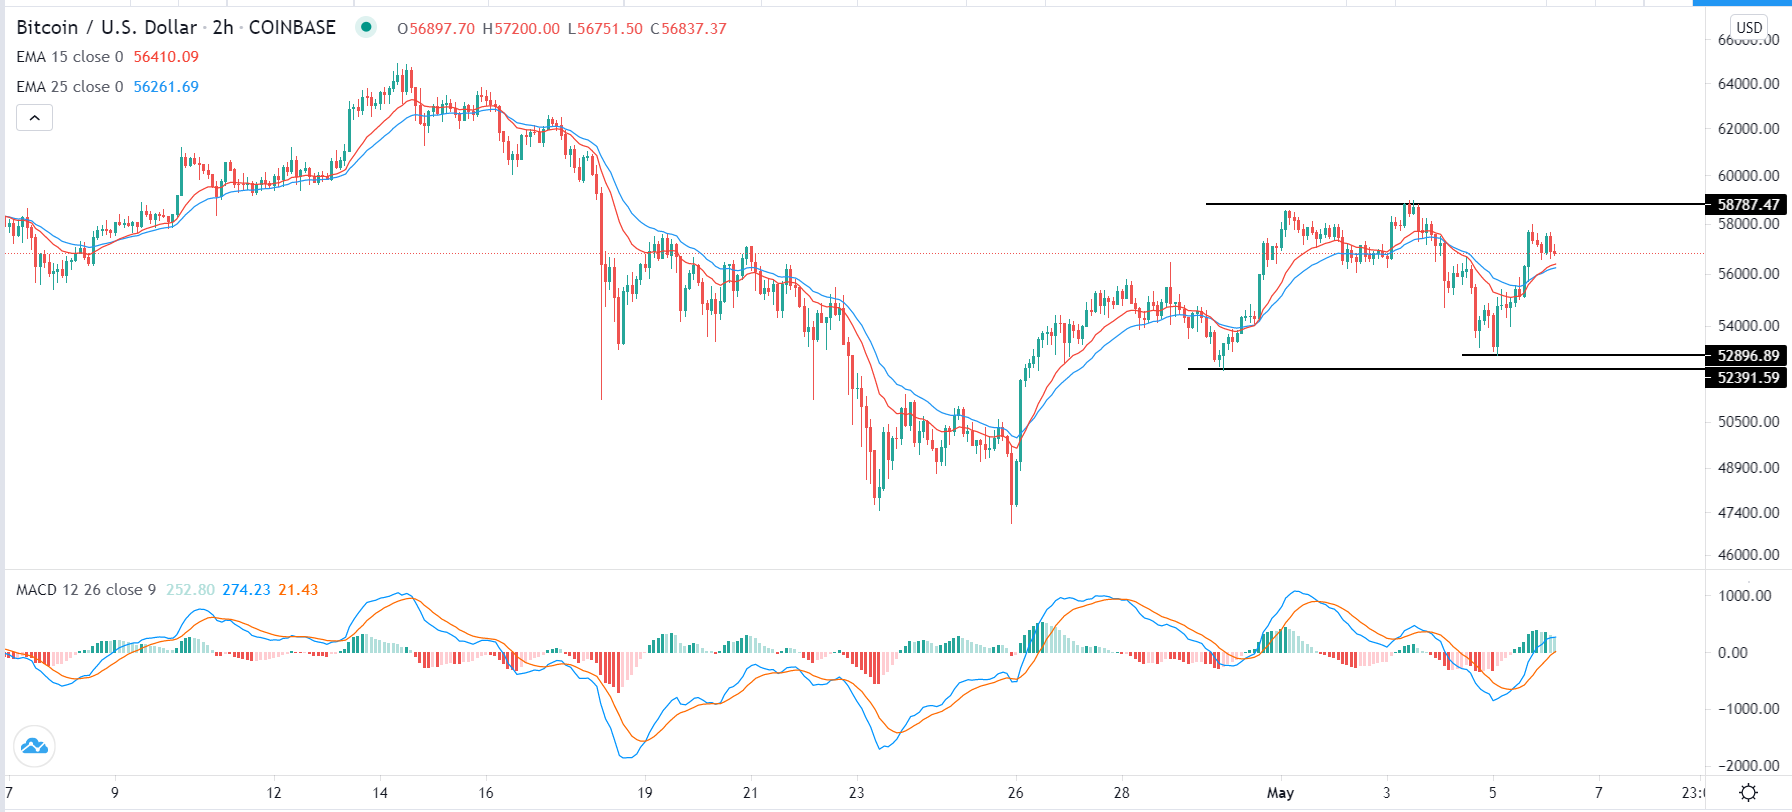
Bearish View
- Sell the BTC/USD (head and shoulders pattern).
- Set a take-profit at 55,000 and a stop-loss at 58,787.
- Timeline: 1-2 days.
Bullish View
- Set a buy-stop at 58,787.
- Add a take-profit at 60,000 and a stop-loss at 56,000.
The BTC/USD is in a consolidation mode as traders shift their focus to altcoins and the ongoing dealmaking in the blockchain industry. There are also concerns of high-interest rates. The Bitcoin price is trading at $56,900, which is about 7% above its lowest level on Tuesday.
Crypto Deal-Making Continues
The BTC/USD is wavering as concerns of high-interest rates in the United States. On Tuesday, Treasury Secretary, and former Fed Chair Janet Yellen sent shockwaves when she stated the obvious about interest rates. In an event organized by the Wall Street Journal (WSJ), she said that the Federal Reserve will be forced to start hiking interest rates to prevent the economy from overheating.
While the Fed has said that it was not concerned about inflation, many analysts believe that the bank will start to tighten since economic numbers have been relatively strong. As such, traders will pay close attention to the latest US initial jobless claims numbers and the upcoming non-farm payroll data. Strong numbers will incentivize the Fed to move faster than expected.
Higher interest rates in the United States will be a bearish thing for Bitcoin prices. This is because the recent rally has been attributed to the easy money policies by the Federal Reserve.
The BTC/USD is also reacting to the deal-making in the industry. Last month, Coinbase Global became the first major exchange to go public when it listed in New York. Yesterday, the industry experienced the first billion-dollar takeover when Galaxy Digital acquired BitGo.
Galaxy is a multi-billion dollar asset manager that is run by Mike Novogratz while BitGo is an institutional custodial company. On the same day, Bitso, a Mexican company, raised more than $282 million, valuing the company at more than $1 billion. This deal-making will likely continue in the coming months as institutions move into the sector.
BTC/USD Technical Analysis
The two-hour chart shows that the BTC/USD pair has found a substantial resistance slightly below 59,000. The pair has also formed a head and shoulders pattern, which is usually a bearish signal. It remains slightly above the 25-day and 15-day moving averages. The fast and slow lines of the MACD have moved slightly above the neutral line while the volume has dropped. Therefore, the pair may break out lower as bears target the next key support at 55,000.

