Bearish View
- Sell the BTC/USD and set a take-profit at 54,000 (61.8% retracement).
- Add a stop-loss at 57,000.
- Timeline: 1-2 days.
Bullish View
- Set a buy-stop at 56,000 and a take-profit at 58,000.
- Add a stop-loss at 54,000.
The BTC/USD price retreated overnight as focus remained on the fast-rising Ethereum. The Bitcoin price retreated from $58,940 to a low of $54,721. Data compiled by CoinMarketCap shows that the currency has a market cap of more than $1 trillion.
Bitcoin Price Declines
The BTC/USD price made an impressive comeback two weeks after it crashed to 47,000. The pair rose by more than 25% from April 25 to yesterday. However, in the past few days, the pair has been overshadowed by the performance of Ethereum.
Ether, the native currency for the ecosystem, soared to an all-time high of more than $3,200 as demand for the network grew. Recently, activity in the Decentralized Finance (DeFi) industry has surged, with the total value locked in the network rising to more than $77 billion. This is notable, since most DeFi platforms have been built on Ethereum’s blockchain. Further, more use cases of Ethereum like in non-fungible tokens (NFT) are coming up.
The Bitcoin price is also declining even after the S&P launched new Bitcoin, Ether and MegaCap indices. The latter index will track the performance of the biggest cryptocurrencies in the world. These indices will form the basis of new passive exchange-traded funds (ETFs), which could lead to more institutional and retail investors.
The BTC/USD pair declined partly because of the relatively stronger US dollar. The US Dollar Index rose by 0.10% in the overnight session as traders wait for the upcoming US non-farm payroll numbers. Stronger-than-expected jibs numbers will put more pressure on the Fed to act to prevent the economy from overheating.
BTC/USD Technical Analysis
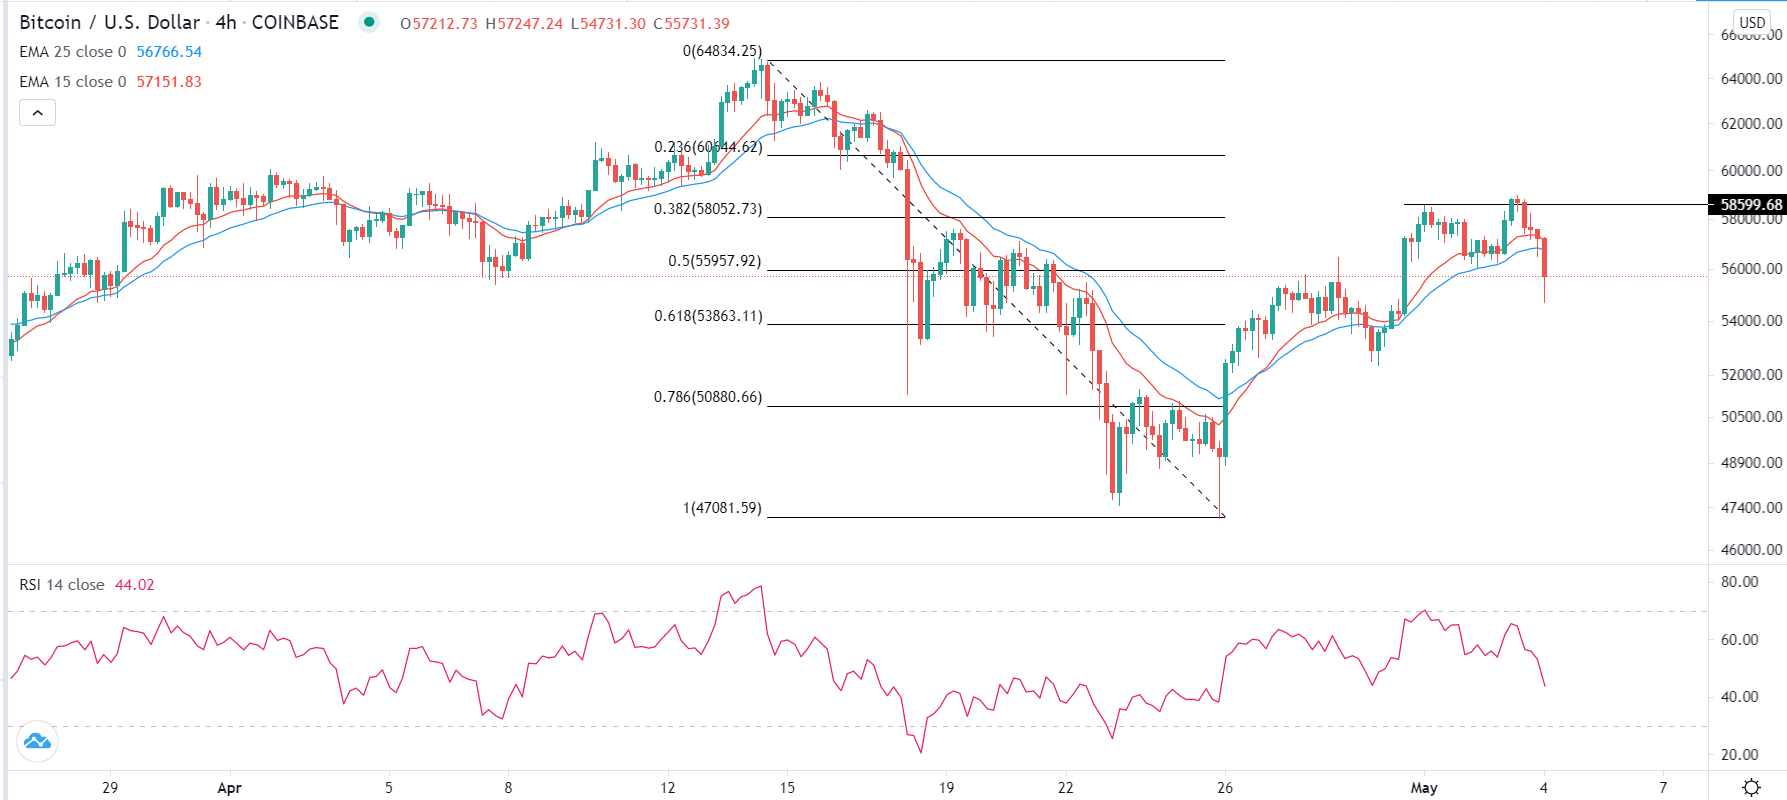
On the four-hour chart, we see that the BTC/USD found a substantial resistance near 58,600. It formed a pattern that is similar to a double-top whose neckline was at 56,000. The pair dropped below this neckline in the overnight session.
It also managed to move below the 25-day and 15-day exponential moving averages (EMA). Also, the price moved below the 50% Fibonacci retracement level while the Relative Strength Index (RSI) has declined to 47.
Therefore, in the short term, the BTC/USD pair will likely continue falling as bears target the n61.8% Fibonacci retracement level at 53,863. However, a bounce above the double-top neckline at 56,150 will invalidate this trend.

