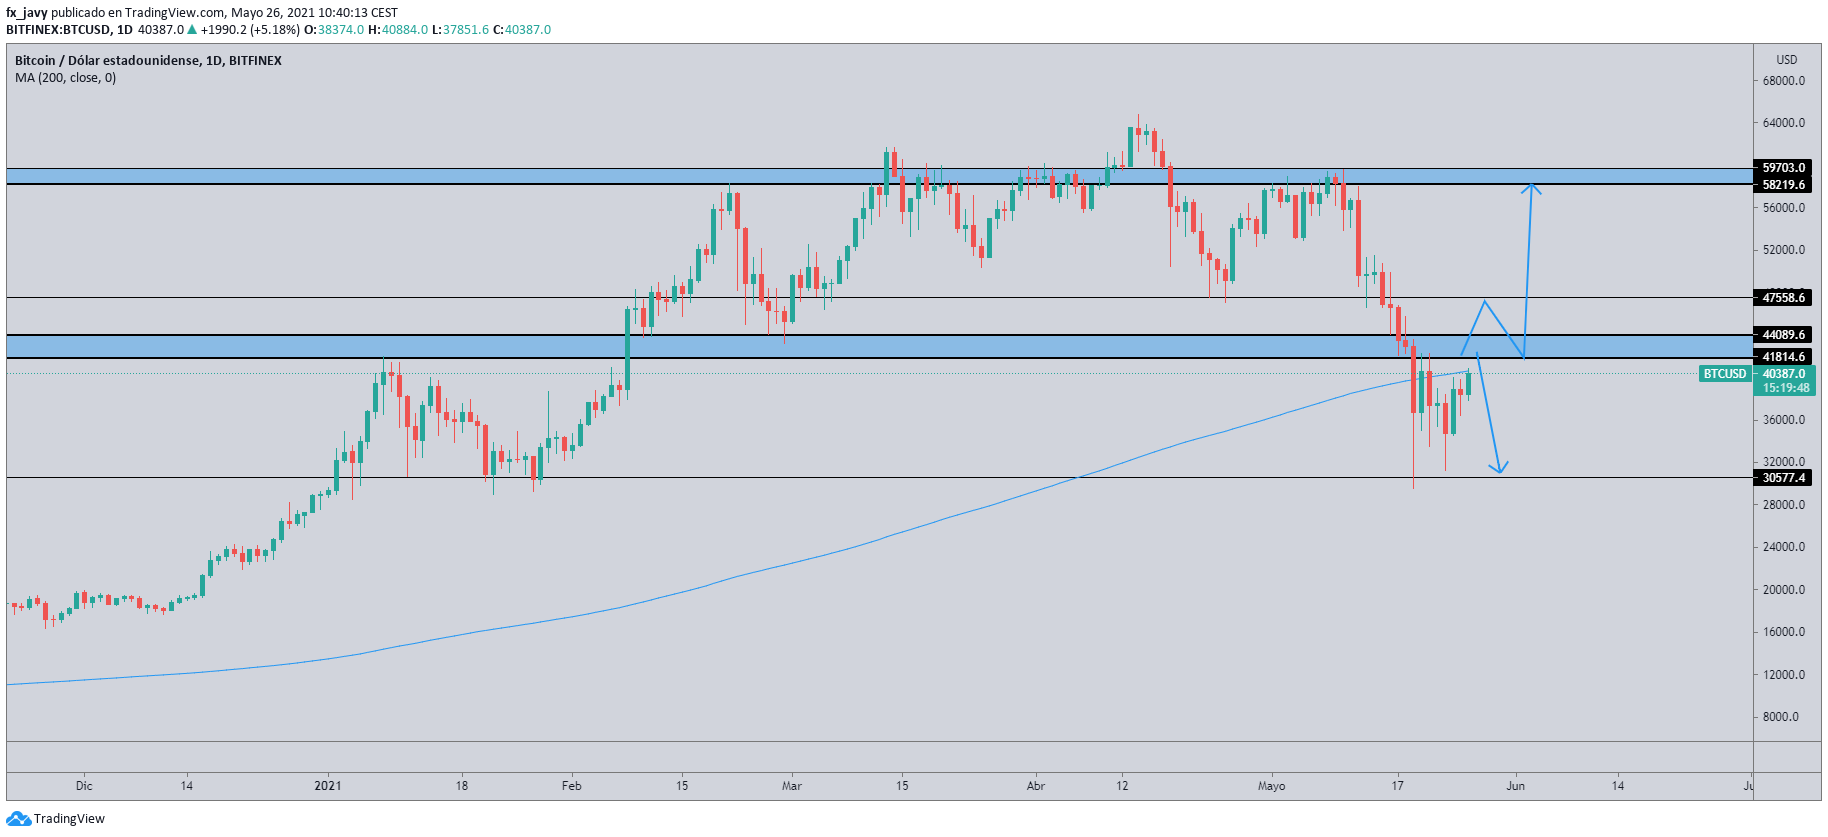
Volatility in Bitcoin remains extreme, which is what makes this asset class so striking. From its highs around $65,000, Bitcoin had a drop of more than 50%, causing the price to fall below $30,000. However, the question remains: has this only been a setback within the current trend? Or are we facing a new downtrend?
Since the beginning of Bitcoin's rise in March 2020, the asset has appreciated by more than 1400%, so we should not balk at corrections as large as these.
In the long term, we continue to see a totally bullish Bitcoin. It is true that it has had a very large correction, but despite this, Bitcoin managed to hold the $30,000 level. Since then, it has managed to recover more than 20% In addition, if we look at that same level using past data, we see how in January 2021 it was validated as a good level of support.
For now, the price is in a range between $42,000 and $30,000, and right at the top of that range is the 200-day moving average on the daily chart. Thus, Bitcoin would need to break through that confluence zone to continue its uptrend with a first target at $58,000.
Otherwise, if this scenario does not occur and we see weakness at the top of the range, we could see Bitcoin again at $30,000, where it would also be a good level to attack and join the overall uptrend.
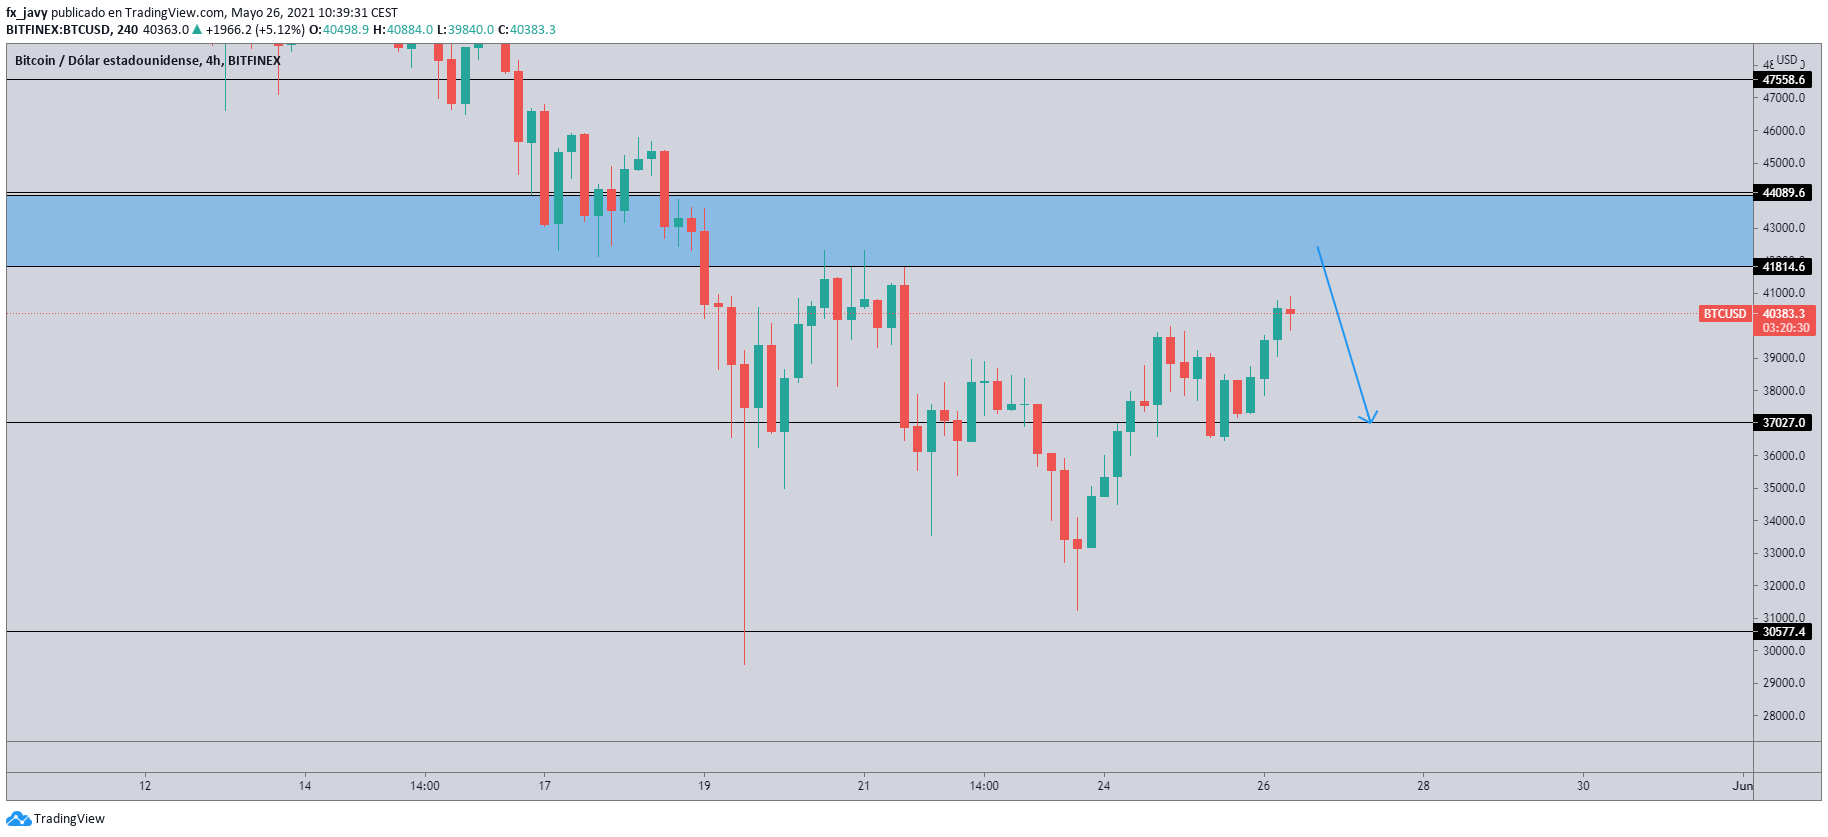
But is there an opportunity to enter the market in the short term? For now, the price is in a range, and the smart thing to do would be to attack it at the extremes of the range. However, if the price shows rejection or indecision at $42,000, you could enter with a short trade with a target at $37,000, which coincides with 50% of the current range and the last higher low of the current uptrend.


