Bullish View
- Set a sell-stop at 1.4100 because of the bearish flag pattern.
- Add a take-profit at 1.4060 (38.2% retracement).
- Add a stop-loss at 1.4160.
- Timeline: 1-2 days.
Bearish View
- Set a buy-stop at 1.4140 and a take-profit at 1.4200.
- Add a stop-loss at 1.4050.
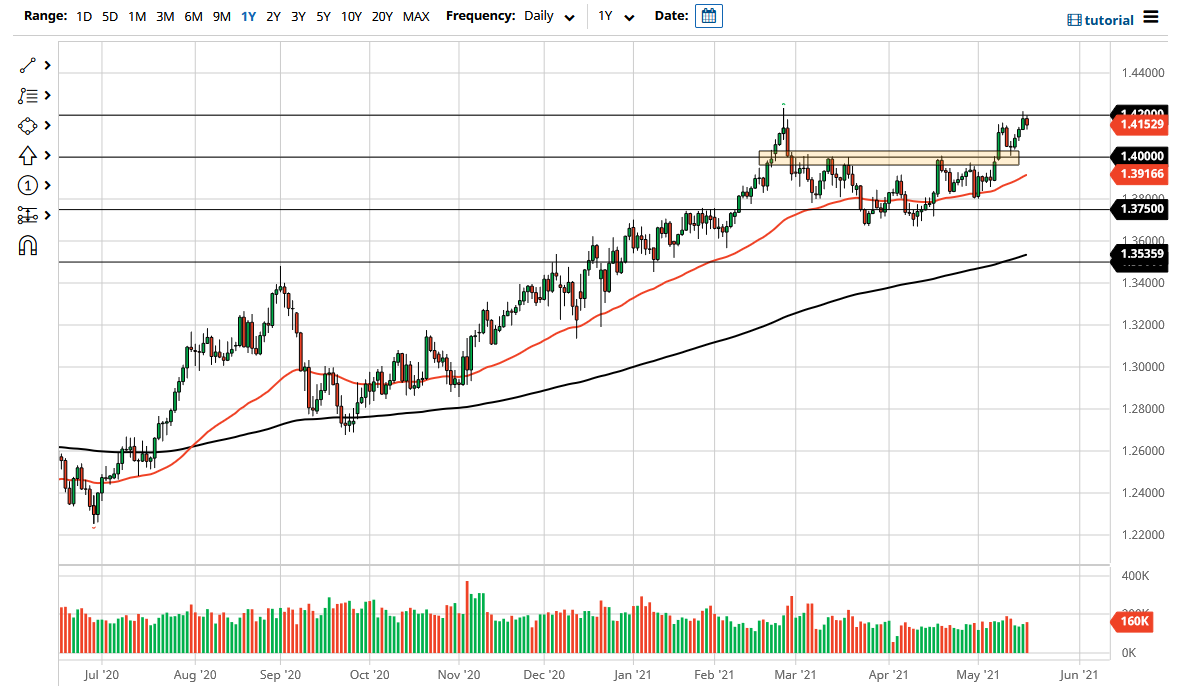
The GBP/USD pair declined in the overnight session after the Federal Reserve minutes of the past meeting. Earlier on, the pair reacted to the strong UK inflation numbers. It is trading at 1.4100, which is 0.8% below yesterday’s high of 0.4220.
Fed Minutes
The Federal Reserve published the minutes of the meeting held in April. The minutes showed that members of the committee started discussing possible tightening measures like tapering of asset purchases. They cited the stronger economic recovery as evidenced by the strong inflation, retail sales, and growth in the labor market.
Recent data showed that consumer inflation rose by 4.2% in April while the JOLTs report revealed that the number of vacancies was increasing.
Further, the bank committed to warning the market in advance before it starts tightening. Still, some market participants are concerned that the Fed will be left behind by other central banks like the Bank of Canada, Bank of England and the European Central Bank (ECB).
Earlier on, the GBP/USD pair reacted to the latest UK inflation data. According to the Office of National Statistics (ONS), the headline Consumer Price Index (CPI) rose from 0.3% to 0.6%. On a year-on-year basis, the CPI more than doubled to 1.5%. This performance was mostly because of the rising food and energy prices. Without the two, consumer prices rose from 1.1% in March to 1.3% in April.
Other numbers published by the ONS were also positive. For example, the Retail Price Index almost doubled to 2.9%, while the Output Producer Price Index rose by 3.9%. Input PPI rose to 9.9% in April. Still, some analysts believe that the current price inflation will start easing as the economy reopens. However, the strong numbers will likely give the BoE more reasons to start tightening.
GBP/USD Technical Analysis
The hourly chart shows that the GBP/USD dropped sharply after the FOMC minutes. As it fell, it moved below the lower line of the Andrews Pitchfork tool. It also declined below the 25-day and 50-day exponential moving averages (EMA). Also, the pair moved below the 23.6% Fibonacci retracement level, which is a bearish signal. It is also forming a bearish flag pattern that is shown in green. Therefore, the pair may soon break out lower as bears target the next key support at 1.4060.

