Bullish Signal
- Set a buy stop at 1.4210 (Tuesday high).
- Add a take-profit at 1.4300 and a stop-loss at 1.4150.
- Timeline: 1-2 days.
Bearish Signal
- Set a sell-stop at 1.4115 and a take-profit at 1.4050.
- Add a stop-loss at 1.4200.
The GBP/USD price is in a tight range as investors reflect on the upcoming full reopening of the UK economy and the relatively robust numbers from the United States. The pair dropped to 1.4116 during the overnight session as the US crawled back after the strong US House Price Index.
UK Upcoming Reopening
The GBP/USD pair is hovering near the highest point since February as investors react to the recent strong economic data from the UK and the upcoming reopening. The pair has gained by more than 3.4% from its lowest level in March, making the British pound the second-best performing currency in the G7 after the Canadian dollar.
The UK has been the second best-performing country in terms of the coronavirus vaccine rollout after Israel. This trend has led to a significant decrease in the number of COVID-related deaths and infections. It has also led to relatively strong economic data from the country. For example, retail sales jumped in April while the unemployment rate declined to 4.8% in March. Similarly, the Manufacturing and Services PMI numbers did well in May. Therefore, investors believe that the trend will accelerate in June as the country reopens fully.
The GBP/USD retreated yesterday after the US published strong house price data. The numbers showed that house prices rose by 13.2% in April after rising by 12% in the previous month. This was the best performance since 2005, three years before the global financial crisis. In the past few months, there has been strong demand for houses because of low-interest rates. Demand for suburban homes has also risen because of the coronavirus pandemic.
The economic calendar will be muted today. The only events that will move the GBP/USD pair are the mortgage data and a speech by Randal Quarles. Their impacts will be relatively modest, though.
GBP/USD Analysis
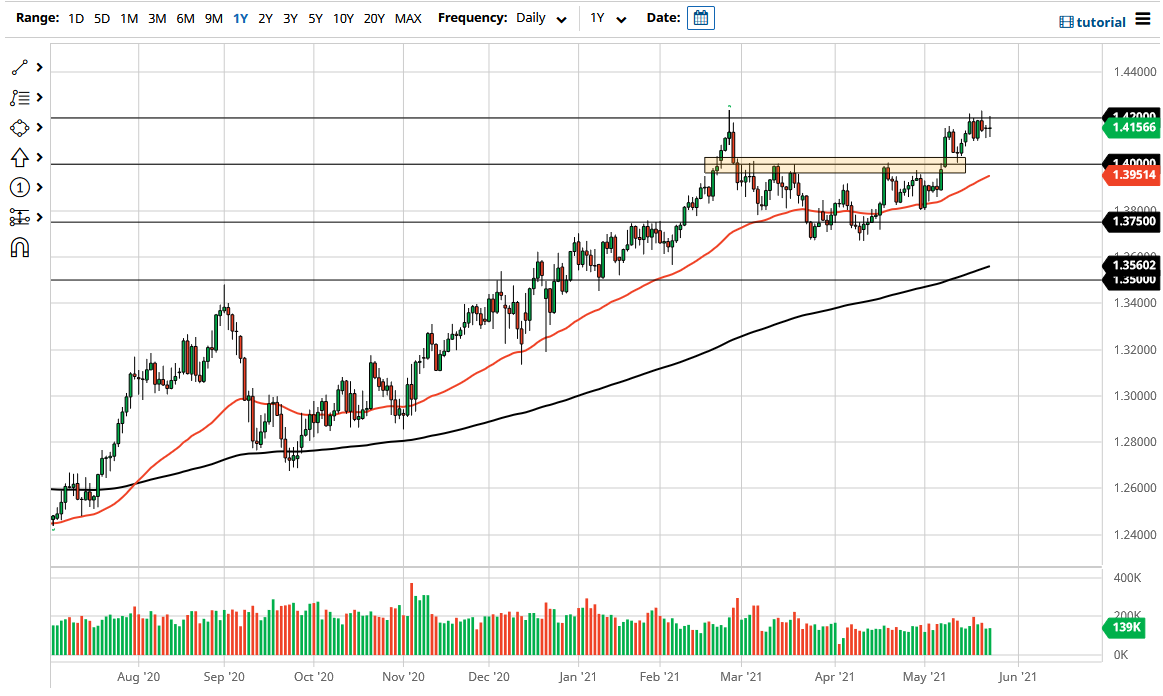
The four-hour chart shows that the GBP/USD has been in a tight range slightly below the year-to-date high of 1.4243. Indeed, the pair is hovering at the 25-day and 15-day exponential moving averages (EMA) level. A closer look shows that this consolidation is part of the handle section of the cup and handle pattern. Therefore, while the pair will likely remain in a range in the near term, there is a possibility that it will have a bullish breakout as bulls attempt to move above the highest level this year. However, a drop below 1.4100 will invalidate this prediction.

