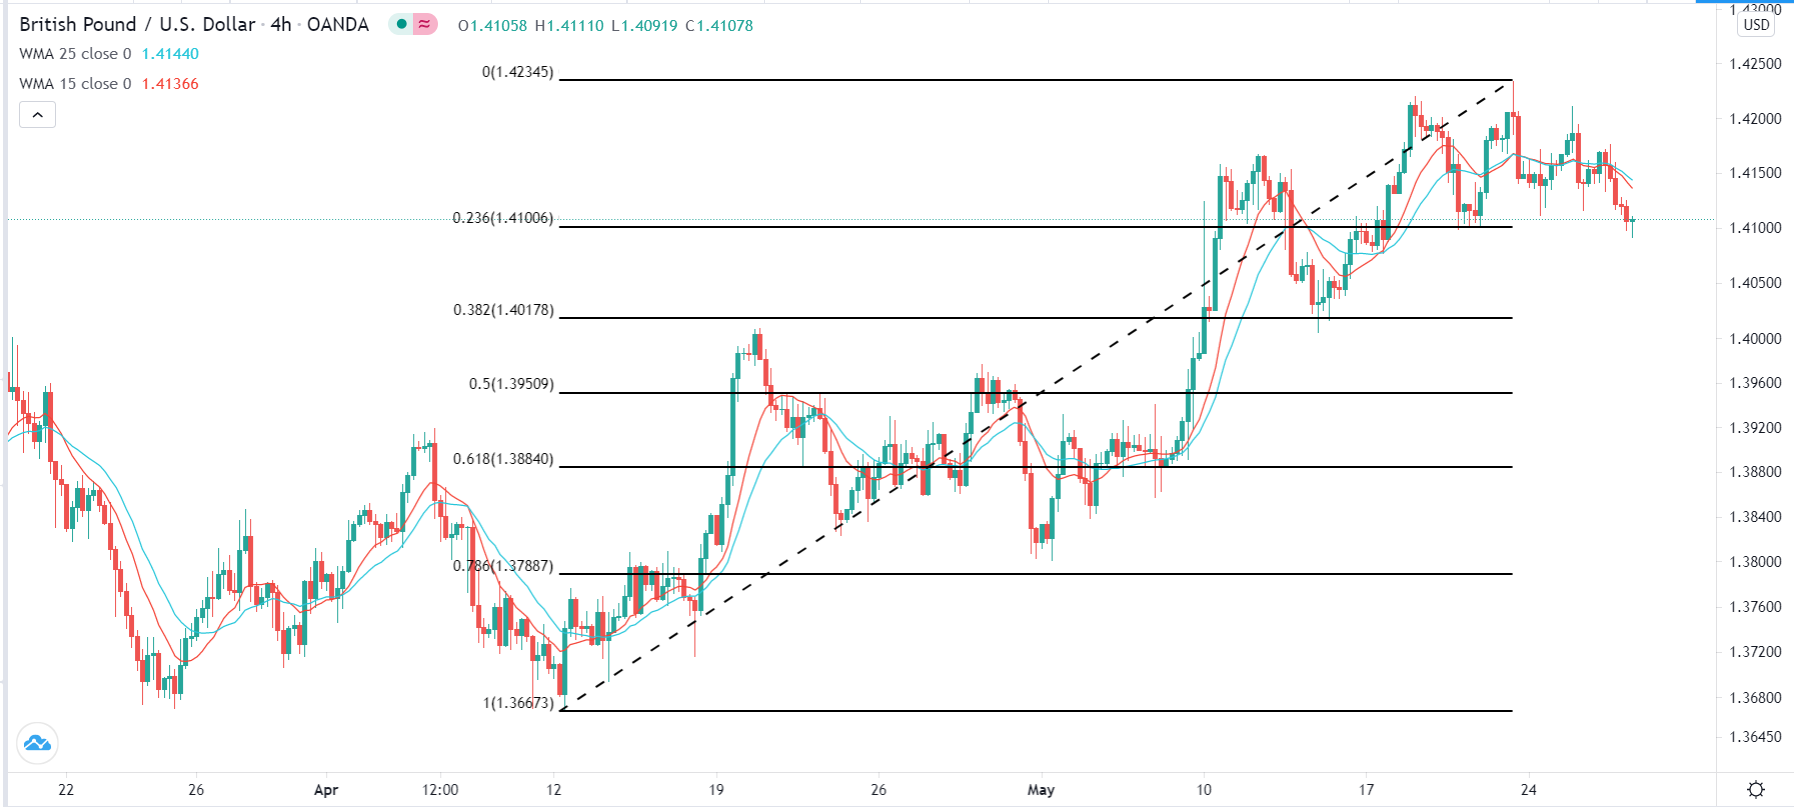
Bearish View
- Set a sell-stop at 1.4100 (23.6% retracement)
- Add a take-profit at 1.4017 (38.2% retracement).
- Timeline: 2 days.
Bullish View
- Set a buy stop at 1.4140 and a take-profit at 1.4235.
- Add a stop-loss at 1.4100.
The GBP/USD price retreated in early trading as the US dollar firmed ahead of the latest US GDP and inflation numbers. It fell to 1.4090, which was lower than this month’s high of 1.4233.
US Dollar Firms
The US dollar gained against most developed and emerging market currencies as traders waited for the latest initial jobless claims, GDP, pending home sales and inflation numbers. The US Dollar Index is down by more than 0.10%.
Since no economic data is scheduled in the UK today, focus will be on the important data from the US. Economists expect the data to show that consumer spending helped boost the US GDP by 6.5% in the first quarter. This is because of the $2.8 trillion stimulus package passed by the government. They expect the data to show that business investments and government spending also improved. However, this being the second estimate, the impact on the GBP/USD will be relatively muted.
The GBP/USD will also react to the latest initial jobless claims numbers. Economists polled by Reuters expect the data to show that initial claims dropped to a post-pandemic low of 425,000 last week. This will be the third consecutive week that the initial claims have fallen. This will be a sign that the US labour market is tightening, which will put more pressure on the Federal Reserve to act.
The US will also publish the latest pending home sales data. The numbers are expected to show that sales rose by 0.8% in April after rising by 1.9% in the previous month. These numbers will come two days after the relatively disappointing new home sales data. House prices have also jumped to the highest level since 2005.
Most importantly, the GBP/USD will react to the upcoming US personal income and spending numbers that will come out tomorrow. These are closely-watched numbers because the Fed pays close attention to them.
GBP/USD Technical Forecast
The four-hour chart shows that the GBP/USD pair has been under pressure lately. It has dropped and is approaching the 23.6% Fibonacci retracement level. The pair has also moved below the 25-day and 15-day exponential moving averages (EMA), which is usually a bearish sign. It has also formed a small head and shoulders pattern. Therefore, the path of least resistance for the pair is lower. If this happens, the next level to watch will be the 38.2% retracement at 1.4017.

