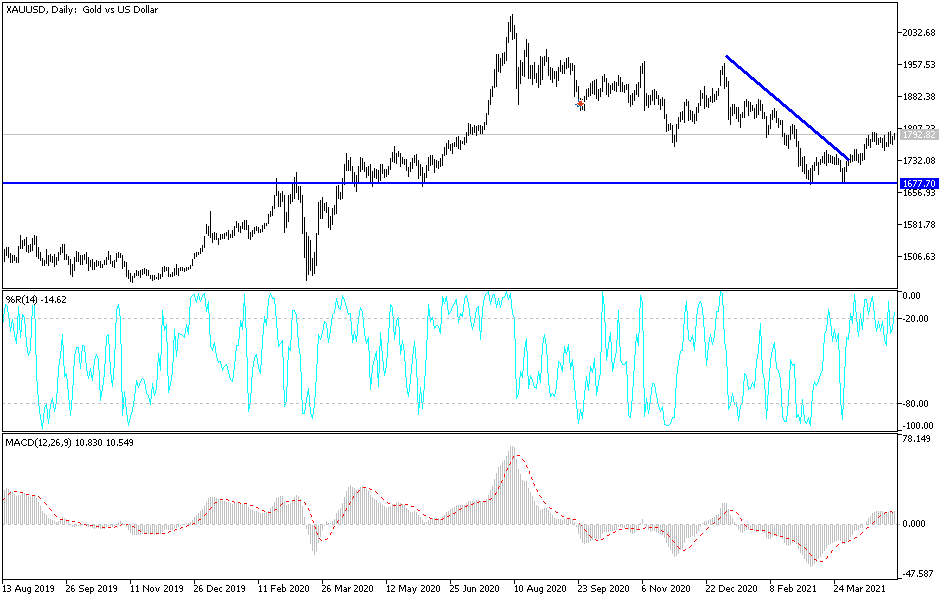
Gold seems to be capitalizing on the fear surrounding India's dire COVID situation and the potential fallout, which may hinder global economic recovery. The price of gold stabilized around the level of $1796 as of this writing, close to the psychological resistance of $1800, which would confirm the bullish trend. The price of gold will be affected today by the strength of the US dollar and the reaction to the announcement of the Bank of England's monetary policy decisions and the number of US jobless claims. This is in addition to the extent of market risk appetite.
The ADP Payroll Processor released a report showing that US private sector job growth accelerated in April but was still below expectations. ADP said US private sector employment jumped by 742,000 jobs in April after it rose by 565,000 jobs adjusted for an increase in March. However, economists expected private sector employment to rise by 800,000 jobs compared to the 517,000 jump that was originally reported for the previous month.
The Institute of Supply Management also released a report showing an unexpected slowdown in the pace of growth in US service sector activity in April. Accordingly, the ISM said that the Services PMI fell to 62.7 in April after jumping to an all-time high of 63.7 in March. A reading above the 50 level still indicates growth in the services sector, but economists expected the index to reach 64.3.
The unexpected drop in the Services Index comes after the ISM released a separate report earlier this week showing an unexpected slowdown in the pace of growth in manufacturing activity in the US.
Technical analysis of gold:
In the near term, it appears that the price of gold is trading within the formation of an upward trend. This performance may remain stable until the reaction of the US dollar to the US jobs data results tomorrow. Accordingly, the bulls will target short-term bounce gains around $1797 or higher at $1,813. On the other hand, the bears will be looking to pounce on pullbacks at around $1762 or less at $1745.
In the long term, according to the performance on the daily chart, it appears that the price of gold is trading within a descending channel formation. It recently bounced back towards the trend line support next to the 100-day simple moving average. It also appears closer to the 14-day RSI overbought levels. Therefore, the bulls will look to riding the current bullish move towards 38.20% and 23.60% Fibonacci levels at $1840 and $1927, respectively. On the other hand, the bears will target gains at 61.80% and 76.40% Fibonacci at $1696 and $1608, respectively.

