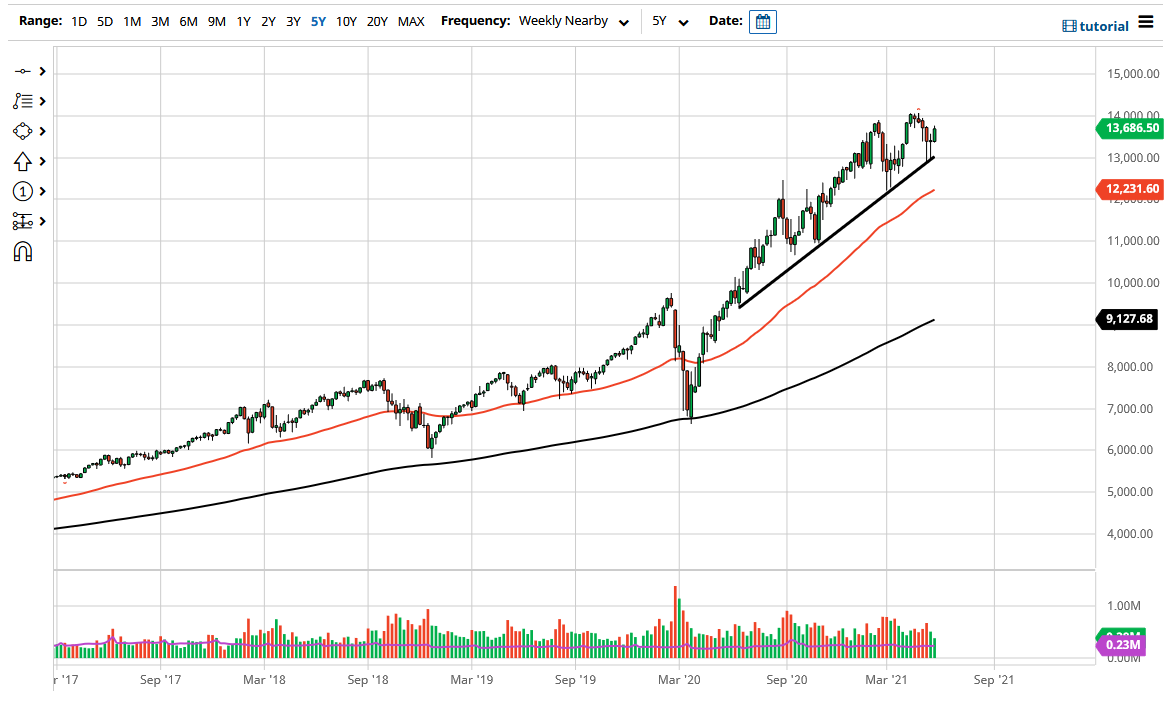
The NASDAQ has risen over the last couple of weeks after initially testing the 13,000 level during the middle of the month of May. By doing so, we have touched a major uptrend line and bounced rather significantly. In fact, the middle two weekly candlesticks from the month have formed hammers, which is a very bullish sign and will attract a certain amount of retail trading at the very least. Because of this, it does look like the buyers are starting to come back in and try to push this market towards the 14,000 level. The 14,000 level is a major top that we have seen so far, but it certainly looks like we are trying to build up enough pressure to break out of an ascending triangle.
If we do break above the 14,000 level, the measured move could be as high as 15,500, and I think that is a very reasonable target over the next month or two, with June more likely than not to be choppy but slightly positive. With this being the case, I do not look at much in the way of momentum right now, but I think it is probably more of a “grind higher” for the month. Regardless, I look at the 13,000 level as a major support level, so if we were to break down below there, it is very likely we will go looking towards the 12,500 level, but that probably is a temporary blip on the radar more than anything else.
If we do get that breakdown, I anticipate that there should be plenty of buyers not only at that area, but also down to the 12,000 level, which is a previous resistance barrier and where the 50-week EMA is coming into the picture. At this point, we could see a little bit of sideways action, so I think that is about as bearish as this market gets. Maybe we need to consolidate a bit before continuing higher. That could put this market in a 2000-point range over the rest the year; but right now, it still looks as if the upward momentum is still the right direction. Regardless, I would not sell this market, because if things get too ugly, the Federal Reserve will step in and do something. With that being the case, more likely than not I would be a buyer of puts on a major breakdown, but there is nothing on this chart that suggests it would be anything more than a quick “smash and grab” type of correction.

