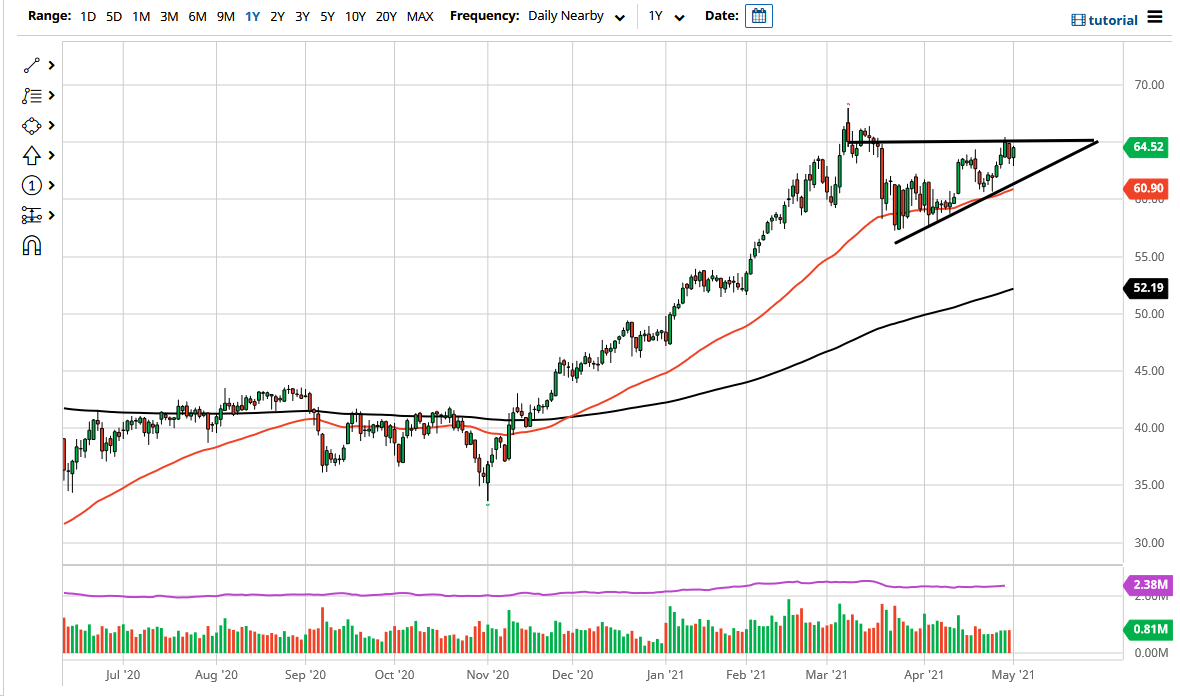
The West Texas Intermediate Crude Oil market initially pulled back during the trading session on Monday but turned around to show signs of strength yet again. At this point, it looks like the $65 level will continue to be very difficult to overcome, and I do believe that it is going to take something rather special to break above there. Nonetheless, the longer-term outlook for this market certainly does suggest that we are going to do that, perhaps testing the $67.50 level initially.
In the meantime, short-term pullbacks continue to be favored overall, as it gives you a little bit of an opportunity for value, and perhaps allows the market to build up enough momentum to try to break out to the upside. After all, the $65 level has been very difficult to overcome, and I think that will continue to be a bit of an issue. Clearing that $67.50 level allows the market to go looking towards the $70 level after that, which is a large, round, psychologically significant figure that will attract a lot of attention.
To the downside, we have a significant uptrend line that has been one of the major drivers of this market to the upside. After all, the ascending triangle is probably going to be fairly obvious for most people, so I think there should be plenty of value hunters coming into the market every opportunity they get on dips. The 50-day EMA is also riding the uptrend line, so it does suggest that there should be dynamic support as well. When you take a look at the ascending triangle, there should be a lot of attention paid to this move, especially as OPEC+ and British Petroleum both have suggested that the demand for crude oil is going to continue to pick up for the rest of the year, at a clip of 6 million barrels a day. Whether or not that is true is a completely different question, because there are a lot of concerns when it comes to demand coming from places like India and Brazil that are seeing massive spikes in coronavirus numbers. Regardless, the market seems to be going higher, and it is most certainly in an uptrend, so until we break down below the 50-day EMA, there is nothing on this chart to suggest that you should be selling.


