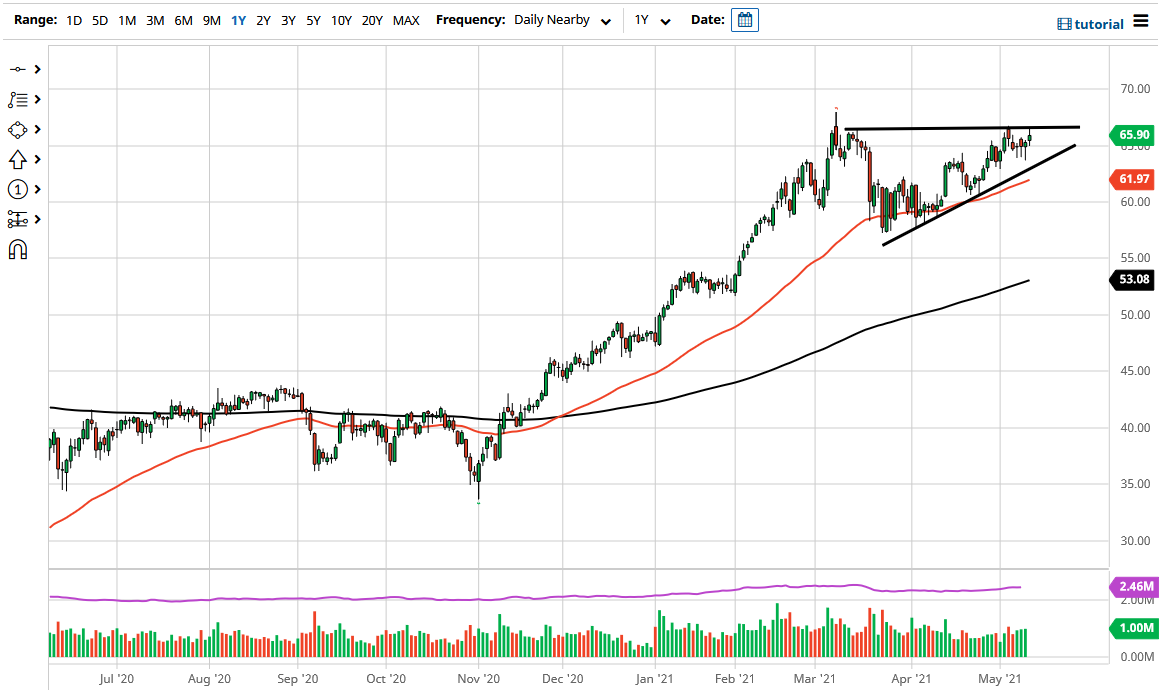
The West Texas Intermediate Crude Oil market initially rallied during the trading session on Wednesday to reach the top of the massive ascending triangle that I have drawn on the chart. It looks as if the $67.50 level will continue to be resistance, and the fact that we pulled back from that area suggests that we are going to continue to be a bit hesitant to go much higher. Furthermore, we also see that the buyers have come back into the market a couple of times, as the three hammers that proceeded this candlestick on the daily chart suggest.
Because of this, I think it is only a matter of time before we would be buyers of oil again, perhaps off a short-term chart that shows a little bit of a bounce. If that does in fact end up being the case, then it is likely that we would have quite a bit of choppiness on short-term charts to finally see the triangle get broken for a bigger move. If and when that happens, the market could very well go looking towards the $70 level, followed by the $72.50 level.
What I find interesting is that the uptrend line of the triangle is also closely followed by the 50-day EMA, so there is a couple of different technical reasons to think that we could have buying pressure there. If we were to somehow break down below that level, then it is possible that we could see a further unwinding of the oil trade, but right now most traders are still banking on the “reopening trade”, and the fact that industry experts expect more demand for the rest of the year.
In the short term, it is possible that we could see a little bit of a pullback, but I think the key phrase there is “short term.” Because of this, I think that you will be best served by looking at little pullbacks as an opportunity to take advantage of better pricing, as we clearly have an uptrend in the market, and this will be especially true if we continue to see the US dollar fall off a bit, as the crude oil market is priced in that very same currency.

