Bearish View
- Sell the AUD/USD and set a take-profit at 0.7650.
- Add a stop-loss at 0.7600.
- Timeline: 1-2 days.
Bullish View
- Set a buy-stop at 0.7720 and a take-profit at 0.7770.
- Add a stop-loss at 0.7680.
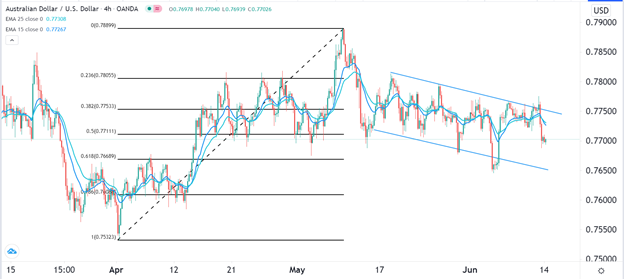
The AUD/USD remained in a tight range on Monday as the Australian markets remained closed for the queen's birthday. The pair is trading at 0.7700, which is about 1% below the highest level on Friday.
Aussie Under Pressure
The AUD/USD pair declined sharply on Friday as traders started to reposition themselves for the Federal Reserve meeting. Analysts believe that the Fed will remain accommodative and leave interest rates and quantitative policies unchanged.
The meeting will come a week after the Reserve Bank of Australia (RBA) also left its pandemic response tools unchanged. The bank will publish the minutes of this meeting on Tuesday. These minutes will show the thinking behind the bank’s decision.
The minutes will come at the same time that the country will publish the latest House Price Index (HPI). Analysts believe that the HPI rose from 3% in the fourth quarter to 5.5% in the first quarter. Recently, the country’s housing market has gotten expensive, thanks to the ultralow interest rates.
Later this week, the AUD/USD will react to a data dump by the Chinese statistics agency. The bureau will publish the latest retail sales, fixed asset investments, and unemployment rate data on Wednesday. These numbers are important for the Australian dollar because it is often seen as a proxy for the Chinese economy. This is because of the significant volume of goods that China buys from the country.
Other notable events that will move the AUD/USD will be the latest US housing starts and building permits data and US retail sales numbers.
Most importantly, the Australian Bureau of Statistics (ABS) will release the latest employment numbers on Thursday. Analysts expect these numbers to show that the economy added more than 30k jobs while the unemployment rate remained unchanged at 5.5%.
AUD/USD Technical Analysis
The four-hour chart shows that the EUR/USD pair has been under pressure lately. As a result, it has formed a descending channel that is shown in blue and moved below the 25-day and 15-day moving averages. It has also moved below the 50% Fibonacci retracement level. It also seems to be forming a head and shoulders pattern. Therefore, the pair will likely keep falling as bears target the next key support at 0.7650. However, a move above 0.7730 will invalidate this prediction.

