Bearish View
- Sell the BTC/USD and add a take-profit at 28,900 (this week’s low).
- Add a stop-loss at 35,000.
- Timeline: 2 days.
Bullish View
- Srt a buy-stop at 36,000 and a take-profit at 40,000.
- Add a stop-loss at 30,000.
The BTC/USD retreated after staging a relief rally on Wednesday. Bitcoin is trading at $32,488, which is about 21% below the highest level this month. It has a market capitalization of more than $611 billion, according to CoinMarketCap.
China and Regulatory Concerns Remain
The prices of Bitcoin and other cryptocurrencies crashed substantially this week as investors reacted to the ongoing crackdown in China. On Monday, the People’s Bank of China (PBOC) asked the country’s banks and other fintech companies like Ant Financial to take more measures to prevent crypto operations. This includes locking accounts that dealt with the coins.
The country has also added more measures to reduce the activities of the coins. For example, users are unable to find crypto exchanges in Baidu, the country’s alternative to Google. Further, the country is doing a major crackdown on mining operations. This has pushed Bitmain Technologies to suspend sales of mining equipment, citing a sharp decline of the machinery.
The BTC/USD is also under pressure as countries step up their regulatory measures as the number of crime related to the coins increase. Some of the most notable crimes are the Colonial and JBS ransomware attacks. The two companies paid the hackers millions of dollars. Meanwhile, in South Africa, two brothers who operated a leading crypto platform have disappeared with more than $3.6 billion.
Bitcoin is also struggling as investors start pricing in a relatively hawkish Federal Reserve. The bank decided to leave interest rates and quantitative easing policies unchanged last week. Officials also hinted that they will start hiking rates in the next two years. Bitcoin and other risk assets tends to underperform when the Fed has a hawkish sentiment. For example, it dropped substantially in 2018 when the Fed made four rate hikes.
BTC/USD Technical Analysis
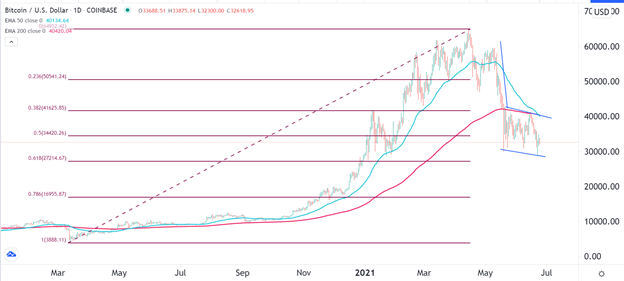
The daily chart shows that the BTC/USD pair has been under intense pressure lately. This has seen it drop by more than 50% from the highest level this year. It has also formed a death cross pattern, where the 200-day and 50-day moving averages make a crossover. Further, it has formed a bearish flag pattern that is shown in blue while the price is slightly below the 50% Fibonacci retracement level. Therefore, the Bitcoin price will likely break out lower in the near term. As such, the next key level to watch will be 25,000.

