Bullish View
- Set a buy-stop at 38,000 and a take-profit at 40,000.
- Add a stop-loss at 36,000.
- Timeline: 1-2 days.
Bearish View
- Set a sell-stop at 36,000 and a take-profit at 33,000.
- Add a stop-loss at 38,000.
The BTC/USD pair is in a tight range after having a tumultuous period in May. Bitcoin is trading at $36,843, which is 23% above the lowest level in May and 38% below the lowest level during the month.
Regulations and Interest Rates
The BTC/USD pair has struggled in the past few weeks as investors continue to worry about global regulations. In May, the People’s Bank of China (PBOC) endorsed a statement by some of the biggest trade groups in finance. The groups urged their members to avoid the cryptocurrency sector because of how volatile and risky it was. This was a notable announcement considering that China is one of the leading players in the sector.
In a recent interview with the Financial Times, the new head of the Office of Comptroller of Currency (OCC) said that several government agencies will ramp up regulations in the crypto industry. This is a deviation from the light-touch approach of the Trump administration. Therefore, after the recent Colonial Pipeline hack, there is a possibility that these agencies will do more.
The BTC/USD will also react to the statements by Federal Reserve officials. Today, Vice-Chairman of Regulation Randal Quarles and Lael Brainard will deliver speeches. The statements will likely move the Bitcoin prices because they will provide more details about interest rates.
In May, the Federal Reserve insisted that it will not hike interest rates and abandon the quantitative easing program even after the positive economic numbers. Therefore, as other central banks like the Bank of Canada and the Reserve Bank of New Zealand (RBNZ) start tightening, analysts will watch out for whether the Fed will change its mind.
Today, the BTC/USD will also react to the latest manufacturing data from the United States. Analysts expect that data by Markit and the Institute of Supply Management (ISM) will show that factory activity continued to do well.
BTC/USD Technical Analysis
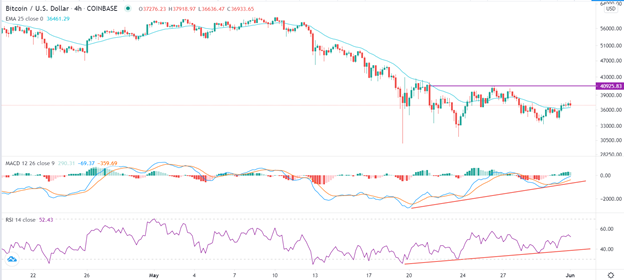
The four-hour chart shows that the BTC/USD pair is in a tight range. It is trading at 36,843, which is in the same range it was yesterday. The pair is also at the same level as the 25-day and 15-day moving average while the MACD and the Relative Strength Index (RSI) have made a bullish divergence pattern. It also seems to be forming an inverted head and shoulders pattern. Therefore, the pair will likely bounce back as investors target the next key resistance at 40,925.

