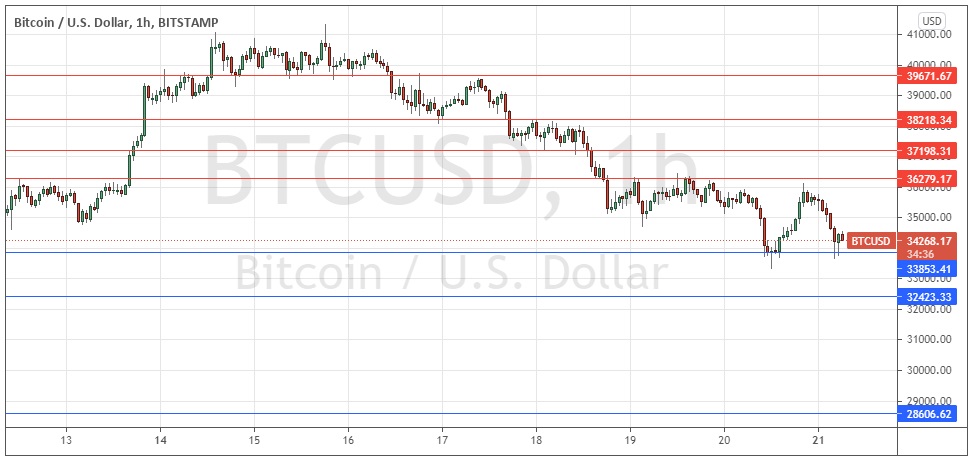
Last Wednesday’s Bitcoin signals were not triggered, as there was insufficiently bullish price action when the support level identified at $38,332 was first reached.
Today’s BTC/USD Signals
Risk 0.50% per trade.
Trades must be taken prior to 5pm Tokyo time Tuesday.
Long Trade Ideas
- Long entry after a bullish price action reversal on the H1 time frame following the next touch of $32,343 or $28,607.
- Place the stop loss $100 below the local swing low.
- Move the stop loss to break even once the trade is $100 in profit by price.
- Take off 50% of the position as profit when the trade is $100 in profit by price and leave the remainder of the position to run.
Short Trade Ideas
- Short entry after a bearish price action reversal on the H1 time frame following the next touch of $36,279 or $37,198.
- Place the stop loss $100 above the local swing high.
- Move the stop loss to break even once the trade is $100 in profit by price.
- Take off 50% of the position as profit when the trade is $100 in profit by price and leave the remainder of the position to run.
The best method to identify a classic “price action reversal” is for an hourly candle to close, such as a pin bar, a doji, an outside or even just an engulfing candle with a higher close. You can exploit these levels or zones by watching the price action that occurs at the given levels.
BTC/USD Analysis
I wrote last Wednesday that we were seeing a bullish tight box consolidation just below $41k with seemingly strong support at $39,672.
I thought that Bitcoin was looking likely to rise to higher prices soon. However, after breaking below the support level at $39,672 the price remained below that level which started to act as support, before falling by approximately 15% over the past few days.
Bitcoin, like almost all other “risk” assets, has been hit hard since last Wednesday’s FOMC release which generated market sentiment which has killed off all the “reflation trades”, including long Bitcoin.
The technical picture here is now much more bearish. This is reinforced by the fact that we have just see a “death cross” on the daily chart, with the 50-day SMA crossing below the 200-day SMA.
Following the initial fall a few weeks ago from an all-time high above $60k, the price retraced as far as the $30k zone which has come to look like extremely pivotal support as a rough halfway market (50% retracement). The price now is close to this zone with price action which is bearish over the short term.
I think that the price is likely to see still lower prices today, and if either of the nearby support levels are reached and show a strong bounce that could be a brave long or medium-term long trade opportunity, with low odds of success but potentially a great reward to risk ratio. On the other hand, if the price gets established below the support level at $28,607, that would be a very bearish and would be likely to trigger a fast, sharp fall to $20k or even $10k, so I see the greatest short-term potential here as clearly on the short side.
There is nothing of high importance due today regarding the USD.


