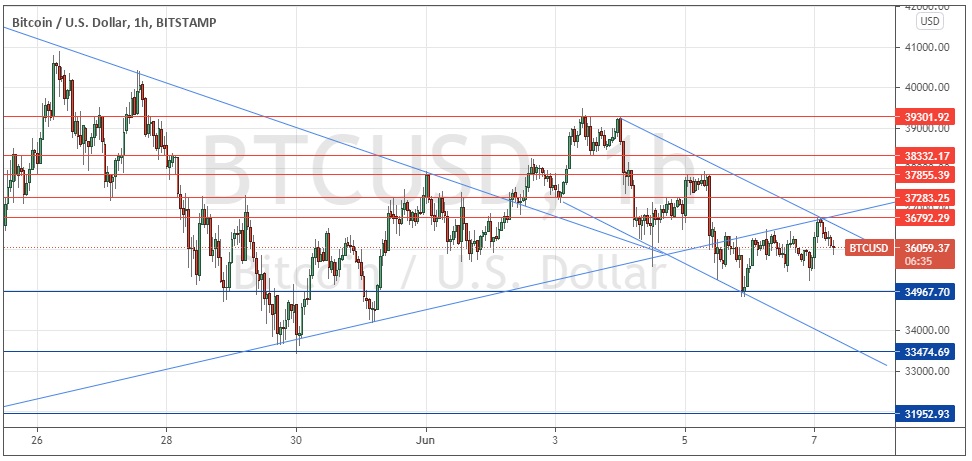
Last Wednesday’s Bitcoin signals were not triggered, as there was no bearish price action at any of the resistance levels which were reached that day.
Today’s BTC/USD Signals
Risk 0.50% per trade.
Trades must be taken prior to 5pm Tokyo time Tuesday.
Long Trade Ideas
- Long entry after a bullish price action reversal on the H1 time frame following the next touch of $34,968, $33,475, or $31,953.
- Place the stop loss $100 below the local swing low.
- Move the stop loss to break even once the trade is $100 in profit by price.
- Take off 50% of the position as profit when the trade is $100 in profit by price and leave the remainder of the position to run.
Short Trade Ideas
- Go short after a bullish price action reversal on the H1 time frame following the next touch of $36,792, $37,283, $37,855, $33,332 or $39,302.
- Place the stop loss $100 above the local swing high.
- Move the stop loss to break even once the trade is $100 in profit by price.
- Take off 50% of the position as profit when the trade is $100 in profit by price and leave the remainder of the position to run.
The best method to identify a classic “price action reversal” is for an hourly candle to close, such as a pin bar, a doji, an outside or even just an engulfing candle with a higher close. You can exploit these levels or zones by watching the price action that occurs at the given levels.
BTC/USD Analysis
I wrote last Wednesday that the dominant technical feature was the consolidating, narrowing triangle which had contained the price for several days. I thought that a breakout from the triangle could be significant, especially as the horizontal key support and resistance levels seemed very evenly balanced and spaced.
We got a bullish breakout from that triangle last Wednesday and I said I would take a long bias if we had gotten two consecutive hourly closes above $39,048. We did not, and this call was enough to keep out of trouble, as the price has fallen quite firmly since it cleared that resistance level the next day.
The technical picture is now more confusing as the price has just gone on to consolidate within the same area despite breaking out of the triangle. All we can see in the price chart now is a short to medium-term new bearish price channel, while if we zoom out and look at the bigger picture, we see a burst bubble and the price consolidating in a shoulder just above the $30k area. Therefore, over the short term, lower prices look likely, while we may have a longer-term buy if the price bounces firmly near $30k and starts to rise with momentum. On the other hand, if the price does get established below $30k, I think it would be likely to fall very quickly to $20k or even $10k, giving short traders a nice opportunity for quick profit.
For today, I will look for short trades from bearish reversals at any resistance level from $37,283 or lower, or for a long trade in the unlikely event that the price reaches and bounces at the support level of $31,953.

Regarding the USD, there are no data releases of high importance scheduled for today.
