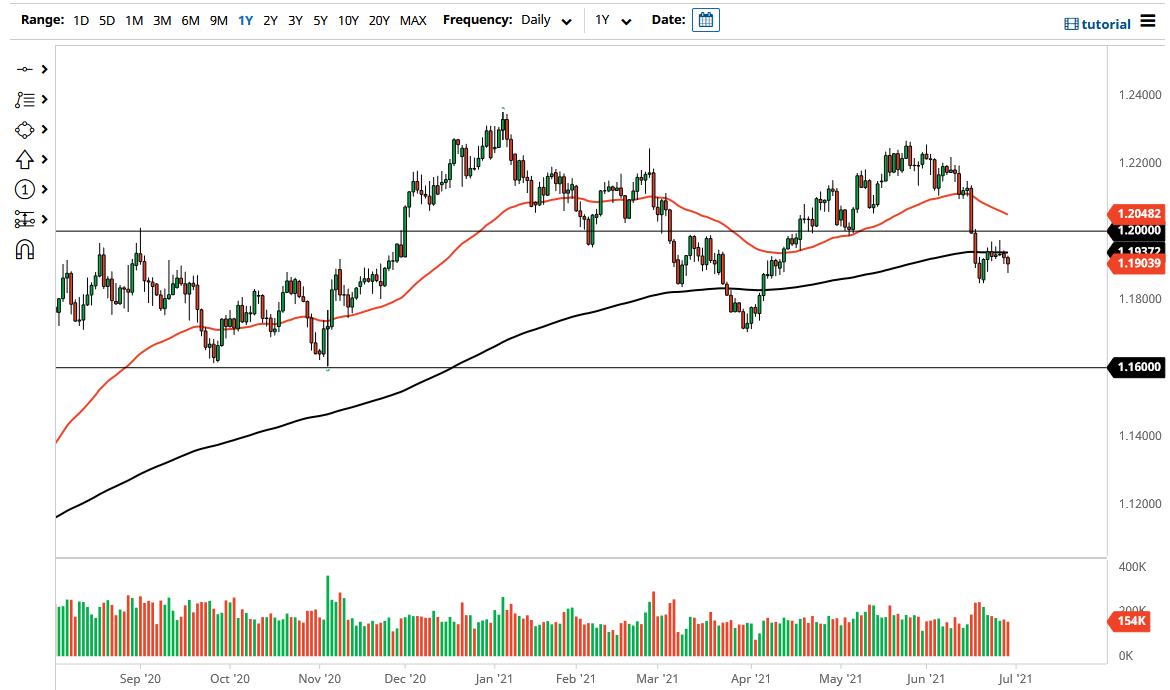
Bearish View
- Sell the EUR/USD and add a take-profit at 1.1825 (78.6% retracement).
- Add a stop-loss at 1.1985 (50% retracemeny).
- Timeline: 1-2 days.
Bullish View
- Set a buy-stop at 1.1930 and a take-profit at 1.2000.
- Add a stop-loss at 1.1850.
The EUR/USD pair tilted upwards ahead of the latest Eurozone consumer inflation and US pending home sales data. The pair rose to 1.1900, which was slightly above yesterday’s low of 1.1880.
US Housing Data
The American housing sector is doing relatively well. On Tuesday, the Case-Shiller national home price index rose by 14.6% year on year in April after rising by 13.3% in March. This was the highest reading in more than 30 years as demand continued to tighten. This growth was mostly because of the relatively low mortgage rates, tight supply, and high consumer confidence.
On Tuesday, data by the Conference Board showed that the overall consumer confidence rose from 120 in May to 127 in June. The survey indicated that more people were planning to buy homes in the near term.
The US National Association of Realtors will publish the latest pending home sales later today. The data is expected to show that pending homes declined by 0.8% in May after falling by 4.4% in the previous month. Last week, data revealed that existing home sales declined in May because of the relatively tight supply.
The EUR/USD will react to the preliminary Eurozone inflation data for June. Analysts expect the numbers to show that the headline consumer price index rose by 1.9% in June after crossing the European Central Bank (ECB) target of 2.0% in May. The harmonised inflation data is expected to rise by 0.9% on a year-on-year basis. In its most recent decision, the ECB said that it expects the ongoing inflationary pressures to be temporary.
The pair will also react mildly to the latest unemployment data from Germany. The data is expected to show that the unemployment rate declined from 6.0% in May to 5.9% in June.
EUR/USD Technical Analysis
The four-hour chart shows that the EUR/USD pair formed a double-top pattern at the 1.1970 level. The neckline of this pattern was at 1.1920. The pair moved below the 25-day and 50-day exponential moving averages and the 61.8% Fibonacci retracement level on the four-hour chart. The Relative Strength Index (RSI) has also moved to the neutral level of 44. Therefore, the pair will likely resume the downward trend as bears attempt to move below this month’s low at 1.1850.

