Bullish View
- Set a buy stop at 1.4200 (Friday high).
- Add a take-profit at 1.4250 (YTD high).
- Set a stop-loss at 1.4130.
- Timeline: 1-2 days.
Bearish View
- Set a sell-stop at 1.4150 and a take-profit at 1.4082 (Friday low).
- Add a stop-loss at 1.4200.
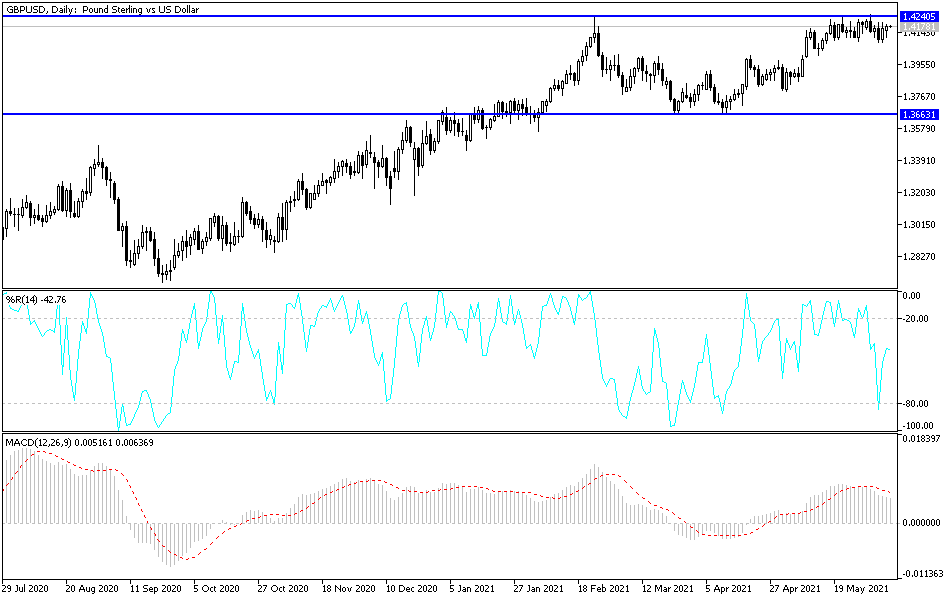
The GBP/USD is holding steady near the highest level this year as investors reflect on the strong UK data and the upcoming US inflation data. It is trading at 1.4171, which is lower than the year-to-date high of 1.4250.
Strong UK Data
The UK economy is doing relatively well, putting pressure on the Bank of England (BOE) to act in its upcoming meeting. For example, house prices have jumped to an all-time high. In a report on Monday, Halifax said that the House Price Index (HPI) rose by 9.5% year-on-year in May. On average, a house price in the UK has jumped by more than 20,000 pounds since the pandemic started.
Other economic data have also been strong. Last week, the Services and Manufacturing PMI data revealed that the two sectors continued performing well. Further, the economy expanded in March for the first time this year. The unemployment rate dropped to 4.8% while retail sales rose.
In a report earlier today, the British Retail Consortium (BRC) said that sales rose by 18.5% in May after rising by 39.6% in the previous month. Later this week, the GBP/USD will react to the latest UK GDP data that will come out on Friday.
The biggest catalyst for the GBP/USD will be the upcoming US inflation data. The numbers are expected to show that the headline Consumer Price Index (CPI) rose from 4.2% in April to 4.7% in May. Similarly, the core CPI is expected to have increased from 2.3% in April to more than 3% in May. If analysts are correct, these will be the highest inflation figures in decades. As such, they will put pressure on the Federal Reserve to act since the labor market is also tightening.
GBP/USD Technical Analysis
The four-hour chart shows that the GBP/USD pair has been in a tight range in the past few sessions. The pair is between the ascending channel shown in black. It is also at the same level as the 25-day and 15-day exponential moving average (EMA). The pair seems to be forming the handle section of the cup and handle pattern.
Therefore, in the near term, the pair will likely remain in the current range and then bounce back. The bullish view will be confirmed if it manages to move above the year-to-date high of 1.4242.

