Today’s WTI Crude Oil Signals
Risk 0.50%
Trades may only be entered before 5pm Tokyo time Wednesday.
Long Trade Ideas
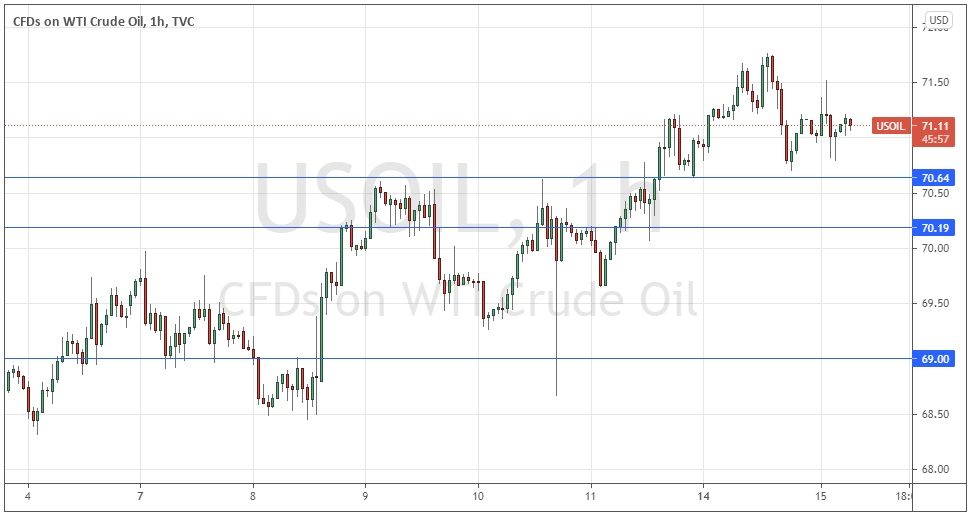
- Long entry following a bullish price action reversal on the H1 time frame immediately upon the next touch of $70.64, $70.19, or $69.00.
- Put the stop loss 10 cents below the local swing low.
- Adjust the stop loss to break even once the trade is 76 cents in profit.
- Take off 50% of the position as profit when the price reaches $1.52 in profit and leave the remainder of the position to run.
The best method to identify a classic “price action reversal” is for an hourly candle to close, such as a pin bar, a doji, an outside or even just an engulfing candle with a higher close. You can exploit these levels or zones by watching the price action that occurs at the given levels.
WTI Crude Oil Analysis
WTI Crude Oil is one of the few market assets showing a strong trend right now, as it continues breaking every day to new multi-year high prices and ending the trading day higher than it began. These are bullish signs technically, but momentum technical analysis is not especially effective as a trading strategy for crude oil. Nevertheless, we see the “inflation trade” still prospering almost every week somewhere since the coronavirus shock in March 2020, and crude oil is currently one of the assets that is being pushed higher by this trade. Nevertheless, as a very vital commodity, its price is driven largely by real demand, which has been growing stronger and stronger as the global economy continues to grow quite strongly. This fundamental factor presents a strong bullish case for WTI Crude Oil.
Where technical analysis comes in most useful for analysing crude oil is in identifying likely support or resistance levels as attractive buying or selling points within a strong trend. This can certainly be applied to the current strong bullish trend by looking for likely support points. The price chart below gives us three levels not far away (identified above) and I will be happy to enter a long trade from any firm bullish bounce we might get following a retracement to one of the levels. The support at $69.00 looks likely to be especially strong, and as the price is approximately a day’s average true range away from it, bolder bullish traders could consider entering a limit order to go long at $69.00 or maybe a few cents above that. The confluence with a round number there, as well as the clear technical features supporting the level, are very encouraging.
Regarding the USD, there will be a release of retail sales and PPI data at 1:30pm London time.


