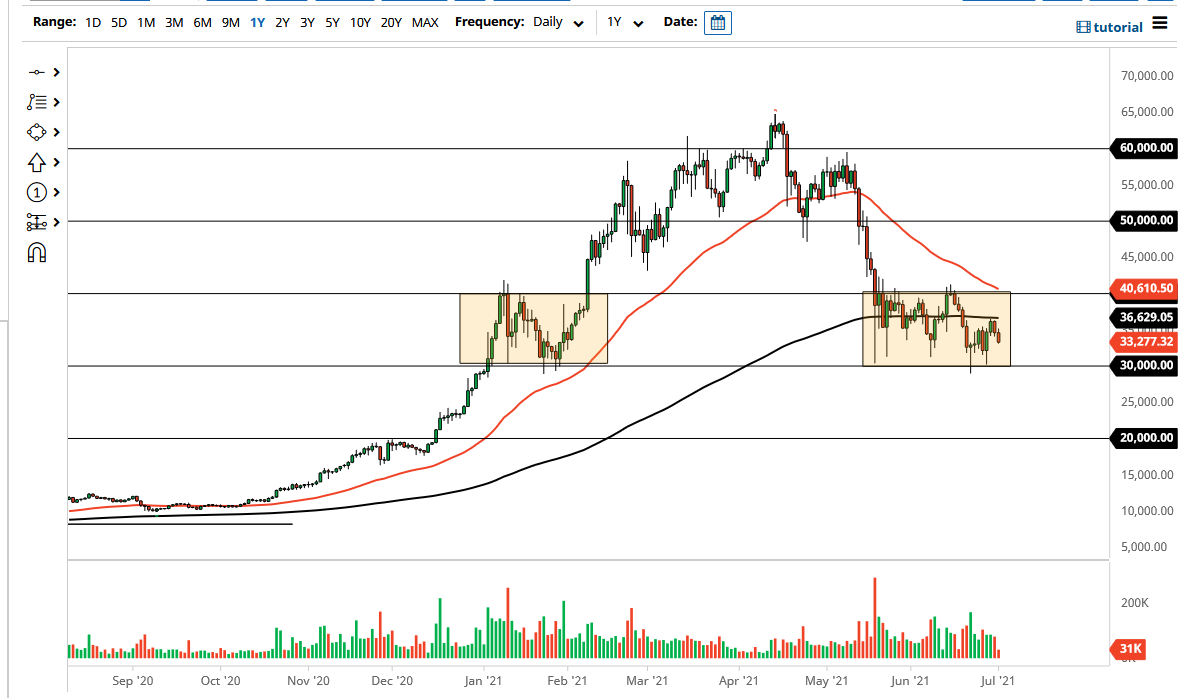
The 200 day EMA is very flat, so that suggests to me that we are more than likely going to continue to be sideways at best. That being said, you can see that I have a rectangle market on the chart that suggests that we are consolidating between the $30,000 level underneath, and the $40,000 level above continues offer resistance. I think that we stay within that range, but once we get a little bit more in the way of certainty, then I think that we have an easy projection of another $10,000 in one direction or the other.
If we break above the $40,000 level and the 50 day EMA as well, then it is likely that we will continue to see the market to go looking towards the $50,000 level above which of course is a large, round, psychologically significant figure and an area that previously had been significant support. Ultimately, the $50,000 level will attract a lot of headline attention as well. With that, the market is likely going to continue to see a lot of action.
On the other hand, we could break down below the $30,000 level, which of course would be very negative. If we break down below the $30,000 level, it is likely that we go looking towards the $20,000 level. That is an area that was essentially the top from the last time there was a Bitcoin bubble, so I think a lot of market memory comes into play there as well. That being said, the market is likely to see a lot of negativity if we do break down below the $30,000 level, and if we do manage to take out the $20,000 level, that could bring in a fresh “crypto winter.” If that is the case, I plan on building up a large position in Bitcoin for the next shot higher. I believe that if we do enter some type of massive bear market, we will probably have a couple of years to build up a larger amount. In the short term though, I think we are simply chopping around and trying to figure out which way we are breaking out of this rectangle.

