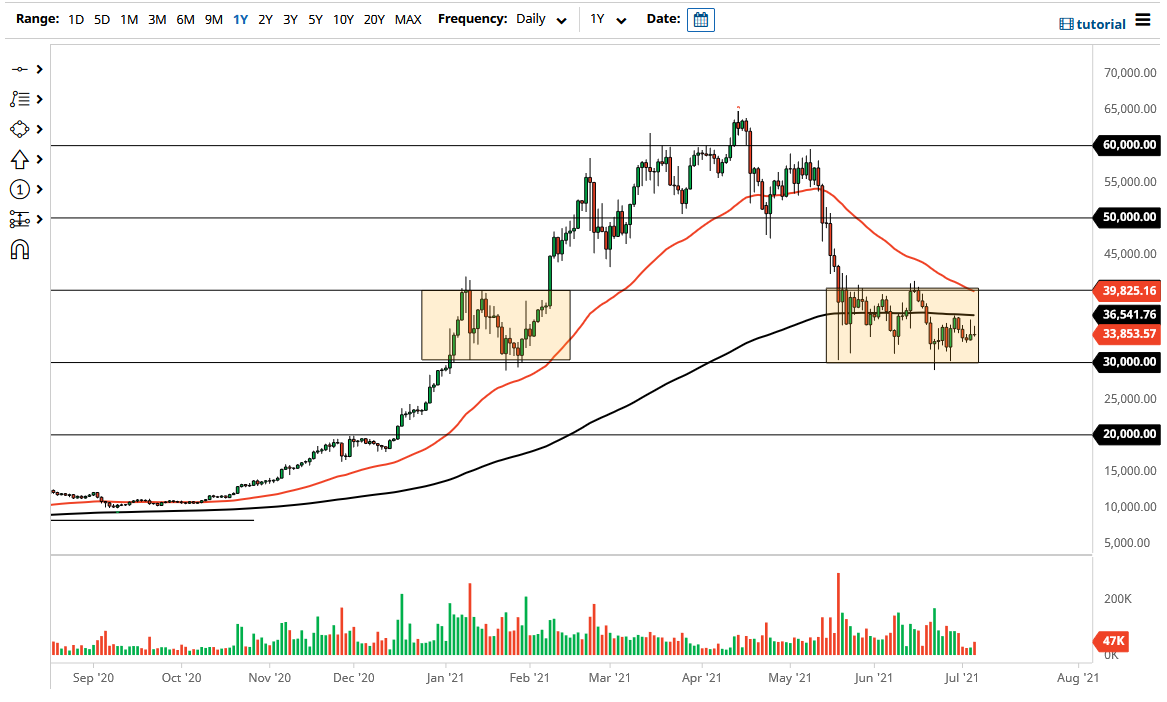
The Bitcoin market rallied during the trading session on Tuesday only to give back quite a bit of the gains and form a shooting star. The shooting star was also the candlestick that we formed on Monday, showing just how vulnerable Bitcoin seems to be at the moment. The 200-day EMA is sitting just above at the 36,500 level and going flat, so I think it is very likely that we at the very least stay sideways in the consolidation rectangle that I have marked on the chart.
Speaking of the rectangle, the $40,000 level above is significant resistance, while the $30,000 level underneath is significant support. With that in mind, I think what we have is an area that people are going to continue to go back and forth in, and ultimately, I think that the market is trying to figure out where to go next. Having said that, the market breaking down below the $30,000 level opens up the possibility of a move down to the $20,000 level based upon the “measured move” of the rectangle. Just as the market could drop down to the $20,000 level, if we break to the upside and above the $40,000 level then I believe it is likely that we will go looking towards the $50,000 level at that point.
It is going to be choppy regardless of what happens next, but it is worth noting that the most recent attempt to break down only produced a very sluggish bounce, and it looks to me like we still have quite a bit of bearish pressure that is more relevant in this market. I think that Bitcoin will continue to be very volatile on a short-term standpoint, but if we do break down below to the $20,000 level, I think there will be even more buyers underneath waiting to get involved in that general vicinity. We could enter a “crypto winter”, meaning that the markets may stay very depressed for a longer timeframe. If that is going to be the case, then I will be accumulating Bitcoin underneath, in order to take advantage of value and ride the next wave higher. I would love to see this break down in order to get cheaper pricing.

