Bullish View
Buy the BTC/USD and add a take-profit at 34,000.
Add a stop-loss at 31,600.
Timeline: 1 day.
Bearish View
Set a sell-stop at 32,000 and a take-profit at 30,000.
Add a stop-loss at 33,500.
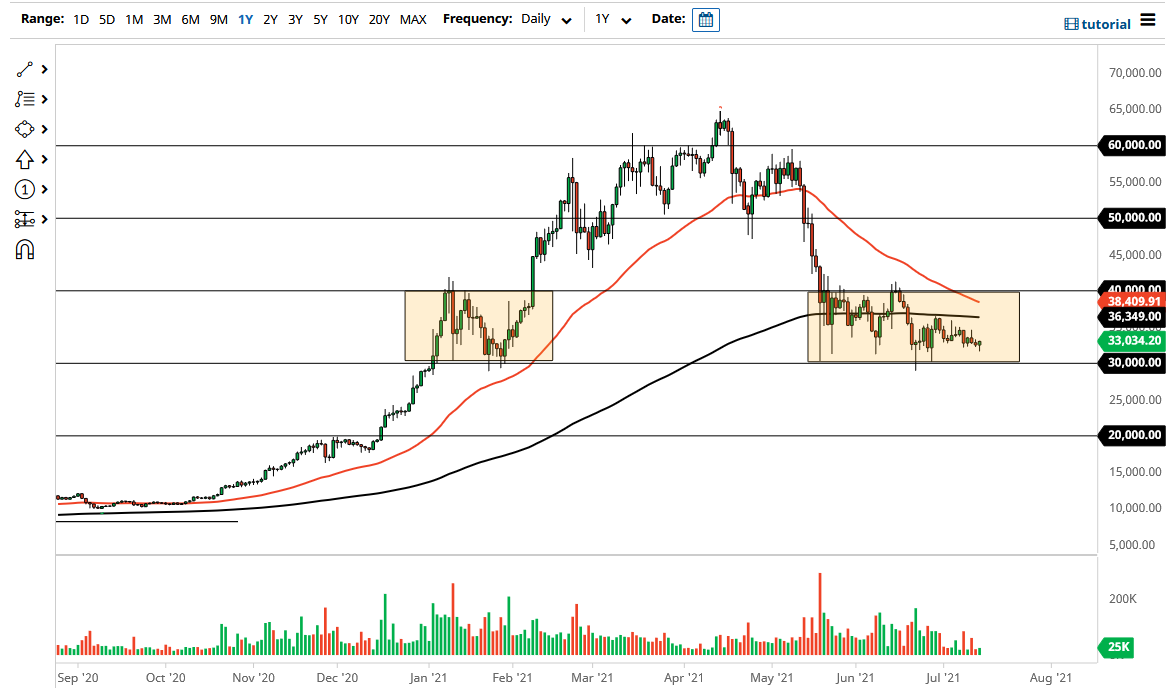
The Bitcoin price is still in a consolidation mode even after the strong US inflation data. The BTC/USD is trading at 32,740, which is in the same range it has been in the past few sessions. This price is about 50% below its highest point this year.
Bitcoin and Inflation
Bitcoin has struggled in the past few months, having declined from its all-time high of $65,000 to the current $32,740. This price action coincided with a period in which the US Consumer Price Index (CPI) rose above the Federal Reserve’s target of 2.0%
Recent data show that the country’s inflation kept rising in June. The headline CPI to 5.4% in June while core CPI rose to 4.2%. This was the biggest increase of prices in more than a decade. The BLS attributed the increase to the overall recovering economy, supply logjam and the overall shortage of parts.
The BTC/USD stabilized on Wednesday after the latest testimony by the Federal Reserve chairman. In it, he said that the bank was watching inflation and that it expected it to subsidize. This statement was seen as being dovish, which is usually a positive thing for risky assets.
Bitcoin price has a close relationship with US inflation. When inflation rises, it signals that the Fed will start to tighten. A hawkish Fed, on the other hand, tends to be negative for risky assets like cryptocurrencies and growth stocks. A good example is when Bitcoin underperformed in 2018 as the Fed made four interest rate hikes. It then rebounded in 2019 when the bank made two cuts.
Meanwhile, on-chain data is improving. Its hash rate has improved, signalling that miners are coming back amid the Chinese crackdown. Also, there is an overall decrease in large volume of Bitcoin being sold.
BTC/USD Technical Analysis
The 4H chart shows that the BTC/USD has been in an overall bearish trend. Recently, it has formed a descending channel that is shown in blue. The coin has moved above the lower side of this channel. Further, it is along the 25-day and 50-day moving averages. The two lines of the MACD have also made a bullish crossover and are heading towards the neutral line. Therefore, the pair will likely keep rising as bulls target the upper side of this channel, which is at 34,000.

