Bearish View
- Sell the BTC/USD and add a take-profit at 31,500.
- Add a stop-loss at 34,500.
- Timeline: 1-2 days.
Bullish View
- Set a buy-stop at 34,000 and a take-profit at 36,000.
- Add a stop-loss at 33,000.
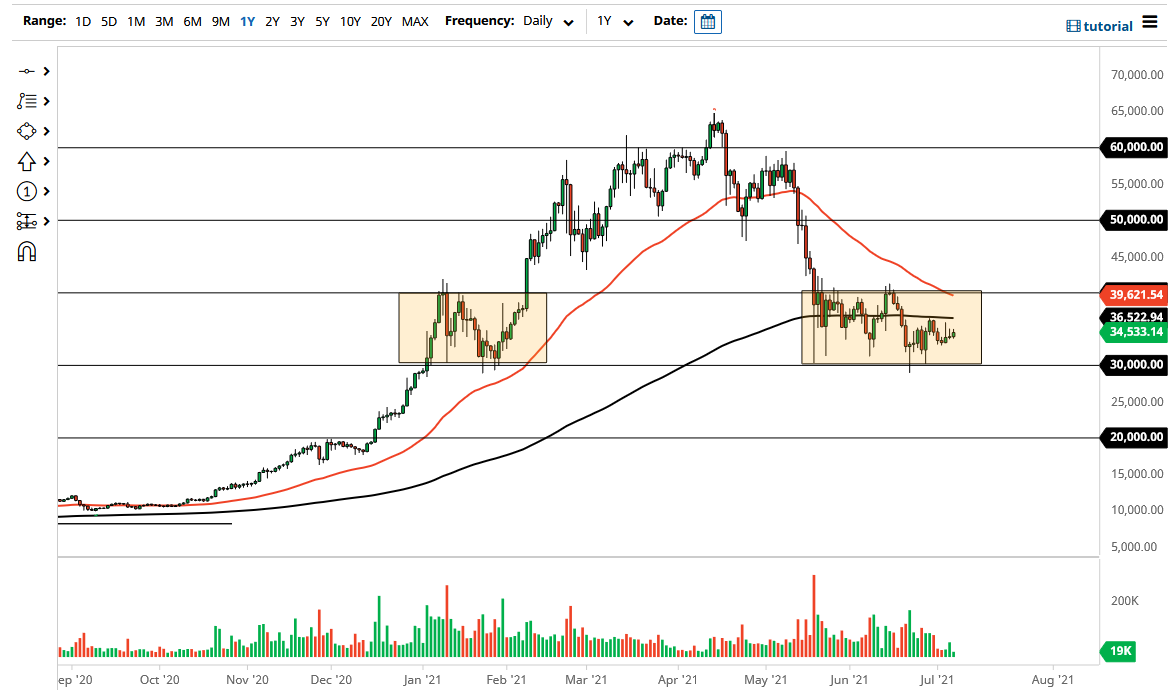
The BTC/USD is in a tight range as investors ponder the next key moves. Bitcoin is trading at $33,200, which is below Wednesday’s high of more than $34,000. The coin has a market capitalization of more than $626 billion.
China Crackdown Intensifies
The Bitcoin price is still struggling after China intensified its crackdown on the industry. In the past few weeks, the country has shut down some of the biggest mining operations, which has pushed the hash rate lower. The country has also ordered banks and other financial companies to stop providing services to people dealing with cryptocurrencies.
This week, the country intensified the crackdown by ordering a company providing software solutions for cryptocurrency transactions. The country’s central bank also warned banks and other financial companies not to provide services related to cryptocurrencies. This includes marketing and providing business premises. The Chinese crackdown is important because of its importance in the industry.
Bitcoin is also in a tight range after the mixed messages coming from the US. The Fed published relatively hawkish minutes on Wednesday. The minutes showed that some members started making the case for tapering of asset purchases, citing the recent strong economic data. This means that these deliberations will take the spotlight in the coming meeting.
At the same time, the bond market is signalling that fears of inflation have reduced. The benchmark 10-year yield declined below 1.3% for the first time in more than 4 months.
The BTC/USD is also wavering as investors focus on the upcoming Ethereum hard fork. The fork is part of the platform’s transition from a proof-of-work to a proof-of-stake network. An update yesterday said that the London hard fork will likely happen in August instead of later this month. The news helped push Ether lower by more than 2%. Ether and Bitcoin have a close correlation.
BTC/USD Technical Analysis
The daily chart shows that the BTC/USD pair has been in a tight range recently. It has struggled moving above the resistance at 35,000. The pair has also formed a descending triangle pattern that is usually a bearish signal. Also, it is below the 50-day volume-weighted moving average (VWMA) while the Relative Strength Index (RSI) has made a bullish divergence. Therefore, the pair will likely remain in this range today and possibly drop to the support level of the triangle at $31,500. On the flip side, a move above 34,000 will invalidate the bearish view.

