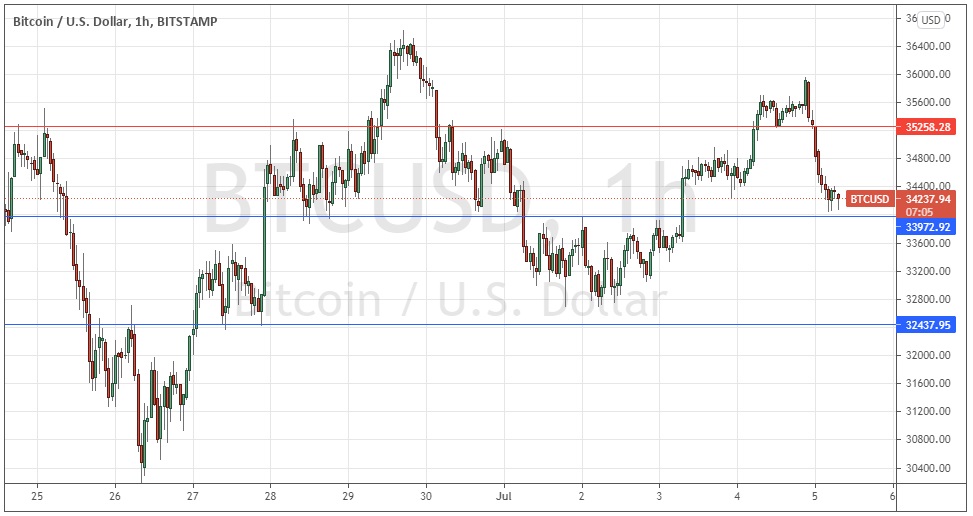
Last Wednesday’s Bitcoin signals were not triggered as there was no bullish price action when either of the identified support levels were first reached.
Today’s BTC/USD Signals
Risk 0.50% per trade.
Trades may only be taken before 5pm Tokyo time Tuesday.
Long Trade Ideas
- Long entry after a bullish price action reversal on the H1 time frame following the next touch of $33,973 or $32,438.
- Place the stop loss $100 below the local swing low.
- Move the stop loss to break even once the trade is $100 in profit by price.
- Take off 50% of the position as profit when the trade is $100 in profit by price and leave the remainder of the position to run.
Short Trade Idea
- Short entry after a bearish price action reversal on the H1 time frame following the next touch of $35,258.
- Place the stop loss $100 above the local swing high.
- Move the stop loss to break even once the trade is $100 in profit by price.
- Take off 50% of the position as profit when the trade is $100 in profit by price and leave the remainder of the position to run.
The best method to identify a classic “price action reversal” is for an hourly candle to close, such as a pin bar, a doji, an outside or even just an engulfing candle with a higher close. You can exploit these levels or zones by watching the price action that occurs at the given levels.
BTC/USD Analysis
I wrote last Wednesday that predicting direction here was challenging. The best I could offer was a forecast that the price was likely to remain within the zone between about $30k and $36.5k for a while longer.
This was not exactly a very precise forecast, but it has proven to be correct over the past few days, with the price remaining within this range.
Bitcoin continues to be hard to read in terms of its most likely next major directional move. The chart below suggests that a bearish medium-term head and shoulders may be close to completing if the price breaks below $32,438. A sustained break below that support level would certainly be a bearish sign. I have been expecting for some weeks now that we will eventually see such a breakdown, but every time it came close, buyers stepped in and held up the price of Bitcoin. So, it seems that there are still plenty of people who see it cheap close to $30k.
The chart also suggests that the nearer support level at $33,973 is likely to hold and may already be producing a bullish reversal even though it has not quite been touched.
Therefore, I am prepared today to take a long trade from a bullish bounce at either $33,973 or $32,438 which may set up later.
Regarding the USD, there is nothing of high importance scheduled for today. It is a major public holiday in the US, which may cause low volatility.


