The difference between success and failure in Forex trading is very likely to depend mostly upon which currency pairs you choose to trade each week and in which direction, and not on the exact trading methods you might use to determine trade entries and exits.
When starting the trading week, it is a good idea to look at the big picture of what is developing in the market as a whole and how such developments and affected by macro fundamentals and market sentiment.
There are a few strong, long-term trends left in the market: U.S. stock markets and WTI Crude Oil are reaching long-term highs.
Big Picture 4th July 2021
Last week’s Forex market saw the strongest rise in the relative value of the U.S. dollar and the strongest fall in the relative value of the Australian dollar, although the values were so small as to be almost negligible.
I wrote in my previous piece last week that the best trades were likely to be as being long of the S&P 500 Index and WTI Crude Oil, and short of Ethereum targeting $1,405. Unfortunately, Ethereum rose by 8.61% over the week, although the S&P 500 Index rose by 1.57% and WTI Crude Oil rose by 1.53%. This produced an averaged loss of 1.84% although without the crypto element, it was an average win of 1.55%.
Fundamental Analysis & Market Sentiment
The headline takeaway from last week was that the era of unlimited central bank stimulus seems to be beginning to come to an end, as inflation expectations are generally rising. However economic growth and employment continue to be generally exceeding expectations, pushing U.S. stock markets and crude oil to all-time or long-term highs, while in the Forex market, the U.S. dollar continues to gain, albeit at a slower pace.
U.S. non-farm payrolls data exceeded expectations somewhat, with 850k new jobs created last month compared to the expected total of 725k. However, the U.S. unemployment rate rose to 5.9% when it had been expected to fall to 5.6%.
The other key data point from last week is the better-than-expected Canadian month on month GDP data, which saw a decline of only 0.3% when it had been expected to decline by 0.8%.
Last week saw the global number of confirmed new coronavirus cases and deaths rise for the second consecutive week after falling for two months, suggesting that the spread of the more highly infectious Delta (Indian) variant is beginning to have an impact on global numbers even though approximately 23.8% of the global population has received at least one vaccination.
Excepting extremely small nations, the fastest progress towards herd immunity has taken place in Iceland, Kuwait, Canada, Israel, Bhutan, Mongolia, Belgium, the U.K. and Chile, which have each inoculated more than 63% of their respective populations. Immunization is now proceeding more quickly in the European Union than it is in the U.S. although the U.S. is ahead of the E.U. with 54% of its population having received at least one shot of a vaccine, while the E.U. has vaccinated 42% of its population. A few nations have begun vaccinating older children, but this is mostly being done on only a limited basis.
The strongest growth in new confirmed coronavirus cases right now is happening in Algeria, Bangladesh, Burma, Cambodia, Cuba, Cyprus, Fiji, Finland, Greece, Indonesia, Iran, Iraq, Kazakhstan, South Korea, Kyrgyzstan, Malaysia, Mexico, Panama, Russia, Senegal, South Africa, Tunisia, Uzbekistan, Vietnam and the U.K. The U.K.’s case seems unusual as it has such a high vaccination rate, although the under-30s within Britain’s ageing population are still mostly unvaccinated.
Technical Analysis
U.S. Dollar Index
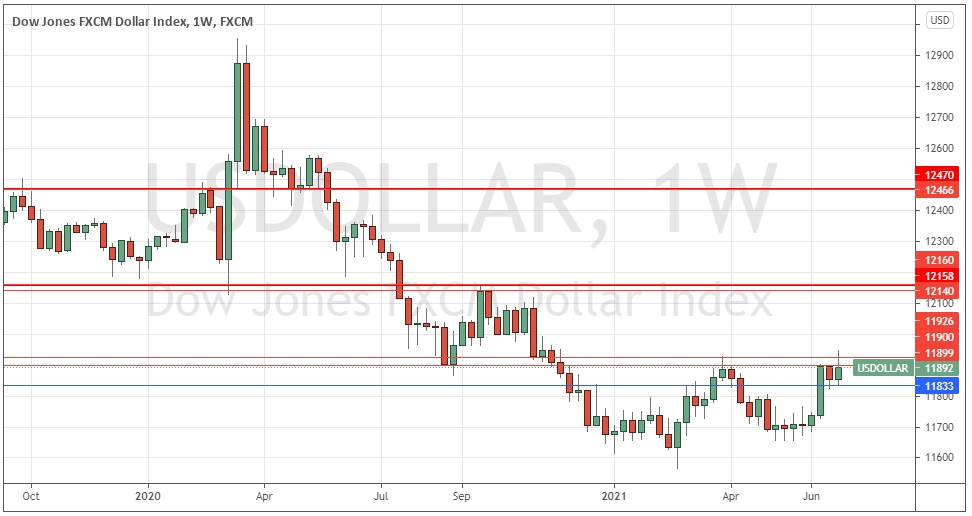
The weekly price chart below shows the U.S. Dollar index printed a bullish candlestick last week. However, it should be noted that the price action was unable to break the nearby resistance levels, and that the candle closed within the bottom half of its range. The Index is above its levels from both three and six months ago which shows a long-term bullish trend is in force. Overall, next week’s price movement in the U.S. Dollar still looks more likely to be upwards than downwards, provided that the support level at 11833 continues to hold up. This suggests that trades long of the USD against other currencies are most likely to be appropriate over this coming week, but the longer the key resistance levels marked in red hold the price down, the less likely we will be to see a further substantial rise soon.
S&P 500 Index
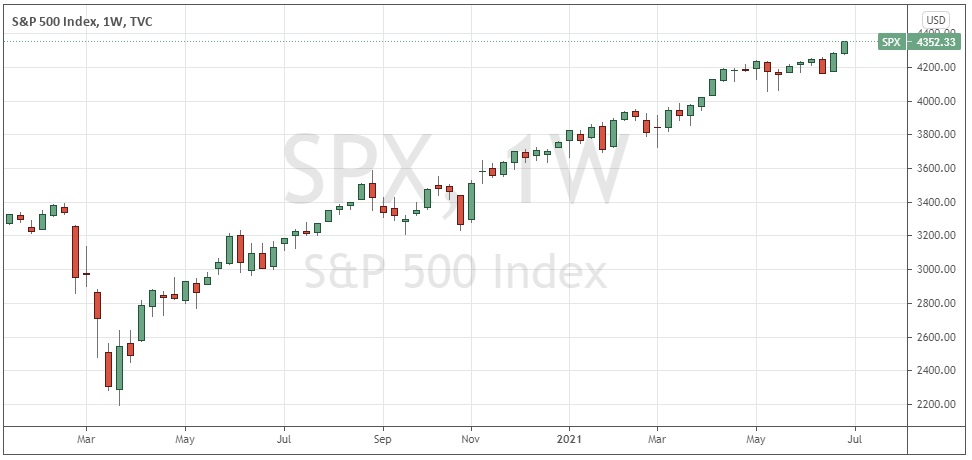
The S&P 500 Index printed a strong bullish candlestick which closed right at the top of its weekly range at an all-time high price. These are simply very bullish signs which indicate a further rise next week is more likely than not to happen. Since the coronavirus crash of 2020, this major U.S. equity index has almost doubled, which is an excellent return over barely fifteen months. The S&P 500 Index remains a buy.
WTI Crude Oil
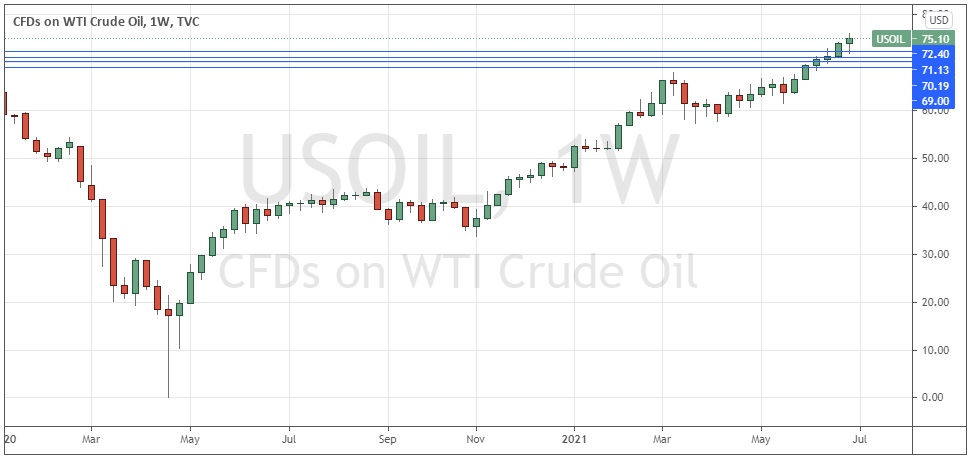
WTI Crude Oil printed a strong, good-sized bullish candlestick last week which closed within the upper third of its price range, again making a new 2.5-year high price. These are simply very bullish signs which indicate a further rise next week is more likely than not to happen. WTI Crude Oil remains a buy but due to high swap fees traders may prefer not to hold this instrument overnight.
USD/JPY
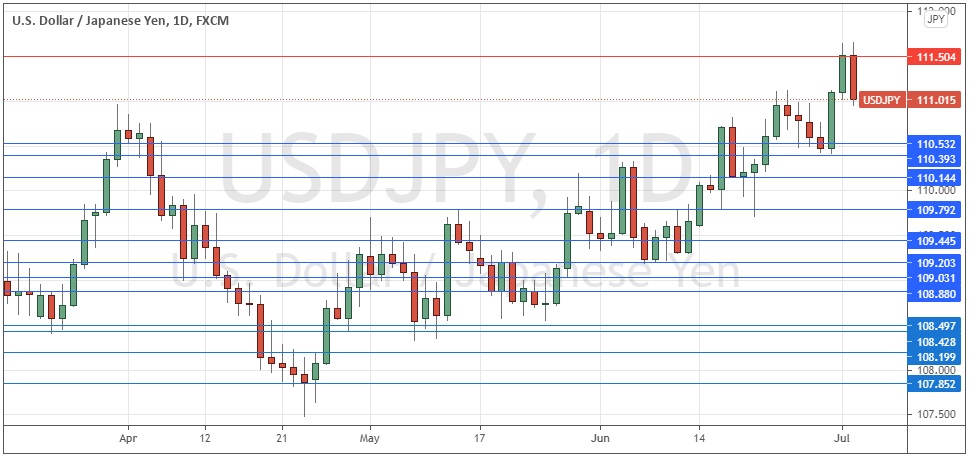
The USD/JPY currency pair made its highest weekly close in over a year but sold off quite strongly on Friday after peaking just after the London open that day. There is clearly a valid, long-term bullish trend here, with the USD unquestionably the strongest major currency in the Forex market. However, the trend recently has been prone to repeated deep pullbacks which have made trading it profitably somewhat challenging. I see the best approach here as waiting for new highs (above 111.51) at the daily (New York) close before entering any long trade.
Bottom Line
I see the best likely opportunities in the financial markets this week as being long of the S&P 500 Index and WTI Crude Oil, and long of the USD/JPY currency pair following a daily (New York) close above 111.51.


