Bearish View
- Sell the GBP/USD and add a take-profit at 1.3600.
- Add a stop-loss at 1.3900.
- Timeline: 1-3 days.
Bullish View
- Set a buy-stop at 1.3800 and a take-profit at 1.3900.
- Add a stop-loss at 1.3750.
The GBP/USD pair declined in the overnight session after the relatively hawkish FOMC minutes. It declined to 1.3775, which was about 0.90% below the highest level this week.
Hawkish FOMC Minutes
The GBP/USD declined as the US dollar strengthened following the release of the previous FOMC minutes. The members deliberated on whether to start scaling down the $120 billion a month asset purchases program.
Some members were supportive of tapering these purchases, meaning that these deliberations will take centre stage in the upcoming meeting. As such, there is a high probability that tapering will take place earlier than expected. Still, some committee members warned against focusing too much on recent data, which they view as temporary. For one, more US states have reopened and the government recently provided trillions in stimulus.
The GBP/US also declined even as US Treasury yields declines. The benchmark ten-year yield declined below 1.3% for the first time in months. This decline was mostly because of the rising concerns about the health of the economy as the Delta variant of COVID-19 spreads. The yield continued falling after the latest Non-Manufacturing PMI data by the Institute of Supply Management (ISM). The data showed that the sector expanded at a less-than-expected pace and a subindex of employment declined.
Meanwhile, the British pound declined after the latest UK RICS House Price Balance. The balance increased from 82% in May to 83% in June. This increase was better than the median estimate of 77%. The data came a day after Halifax released relatively weak UK House Price Index. The data revealed that the index declined by 0.5% in June as the government started winding down the stamp duty waiver.
GBP/USD Technical Outlook
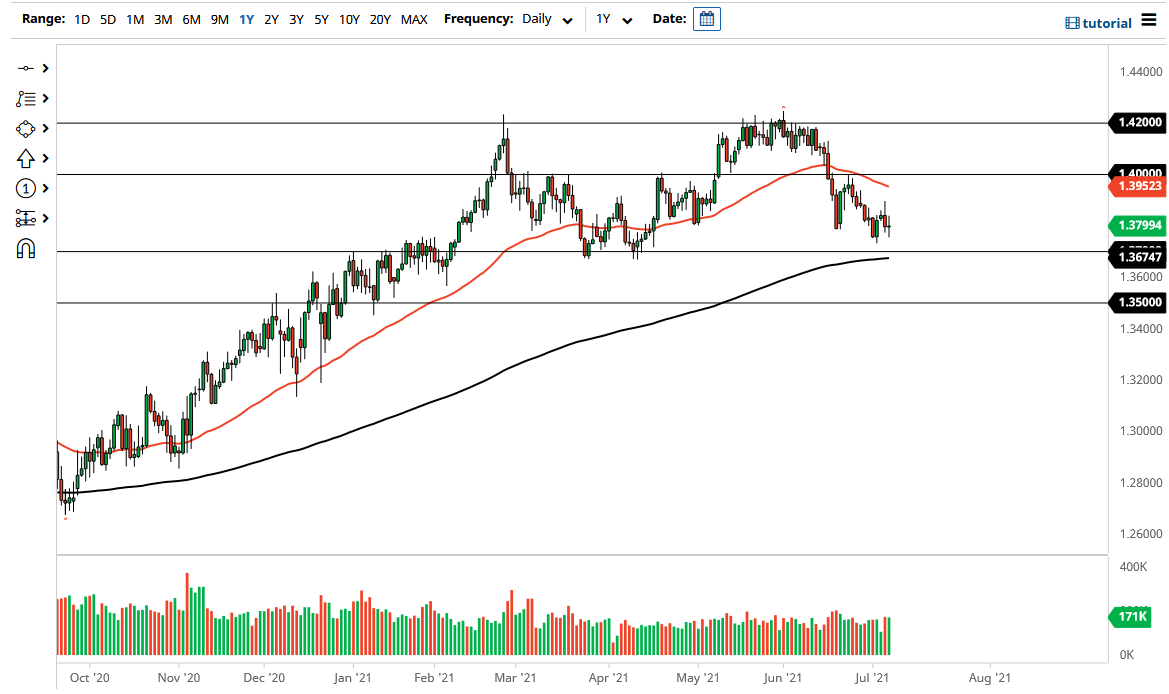
The daily chart shows that the GBP/USD declined below the rising wedge pattern two weeks ago. This pattern is usually a bearish sign. The pair also moved below the 25-day and 15-day exponential moving averages and the Ichimoku cloud. The Relative Strength Index (RSI) and MACD have also continued dropping. Therefore, the path of the least resistance for the pair is lower. If this happens, the next key support level to watch will be 1.3600, which is about 1.28% below the current level. This forecast will be invalidated if the price moves above resistance at 1.3900.

