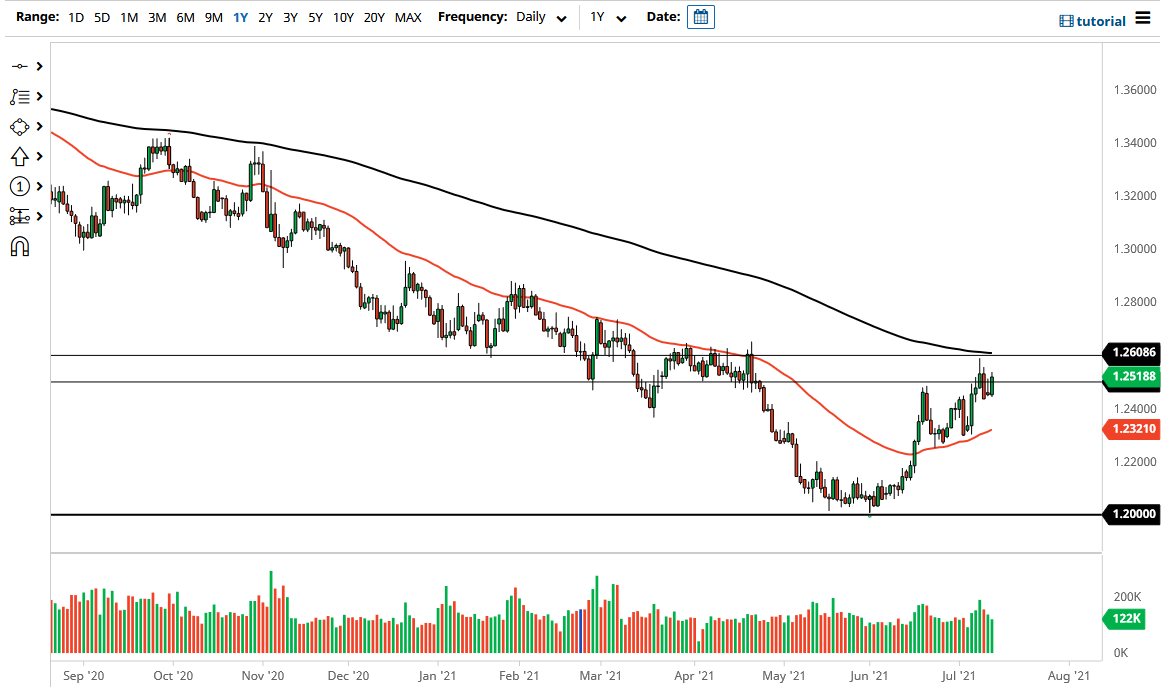
The USD/CAD pair rose again during the trading session on Tuesday as we have broken above the 1.25 level yet again. The size of the candlestick is relatively strong, and it should also be noted that the “inverted hammer” that formed during the Monday session was broken above, so it certainly shows that there is a significant amount of strength.
When you look at this chart, you can see that the 1.25 level offers a significant amount of resistance that extends all the way to the 1.26 handle. At the 1.26 level, you can also see that we have the 200-day EMA sitting on top of it, which suggests to me that the market will see a lot of selling just above. It is because of this that I am watching this market very closely, because it is moving higher in the face of oil markets also rallying overall. Yes, crude oil has been a bit sideways as of late, but this pair started rising much earlier than that. Because of this, there is something a bit more significant going on under the surface, and I think a lot of traders may be caught on the wrong side of this setup.
If we were to break above the 200-day EMA on a daily close, I am more than willing to take a shot at a longer-term bullish position, with the understanding that it is probably going to be very noisy. At that point, it would be a trend change from my point of view, so I would not necessarily have a specific target quite yet. This is because it could open up a longer-term “buy-and-hold” scenario, especially when you look at the monthly charts. The 1.20 handle underneath was a massive support level based upon those monthly charts, and I think we need to continue to look at this as a potential trend change that could run for quite some time, possibly in the realm of multiple months.
On the other hand, if we were to turn around and break down below the 50 day EMA, then I might be a seller, because at that point I think we would probably go looking towards the 1.20 handle yet again. The next couple of weeks will probably end up being a major decision point for this pair, so by all means keep this chart open on your platform.

