Bullish view
- Set a buy-stop at 48,000 and a take-profit at 50,000.
- Add a stop-loss at 46,000.
- Timeline: 2 days.
Bearish view
- Set a sell-stop at 46,000 and a take-profit at 44,000.
- Add a stop-loss at 47,000.
The BTC/USD price retreated in the overnight session as the strong recovery took a breather. Bitcoin declined to $45,242, which was substantially lower than the weekend high of more than $48,000.
Bitcoin Rally Takes a Breather
Bitcoin has been on a strong bullish momentum recently. After falling below $30,000 in July, the price rebounded by more than $18,000 during the weekend. As a result, its total market capitalization jumped to more than $800 billion.
This rally happened as investors became convinced that the price had reached a bottom. Besides, it had struggled to move below $30,000 several times since May this year.
The recent rally is mostly because of the likely embrace by large companies. On Monday, it was revealed that tech giants like Alibaba and Microsoft were considering using blockchain tools to fight piracy. The two firms will use products built on Ethereum’s network.
Meanwhile, Walmart advertised a position on cryptocurrencies lead. The company’s employee will oversee blockchain-related roles in the company. This could involve integration to its e-commerce platforms and even future investments.
The job advert came a few months after Amazon announced a similar role. Therefore, this is a sign that the biggest American firms are taking cryptocurrencies more seriously. More large firms could also start embracing the coins in the near future.
The BTC/USD next key catalyst will be a statement by the Federal Reserve chair. Jerome Powell will have a speech later today. In it, he will likely talk about the bank’s plans to abandon the easy-money policies by tapering its asset purchases. The Fed is an integral player in the crypto industry. For one, a dovish sentiment is viewed favourably for digital coins.
BTC/USD Technical Analysis
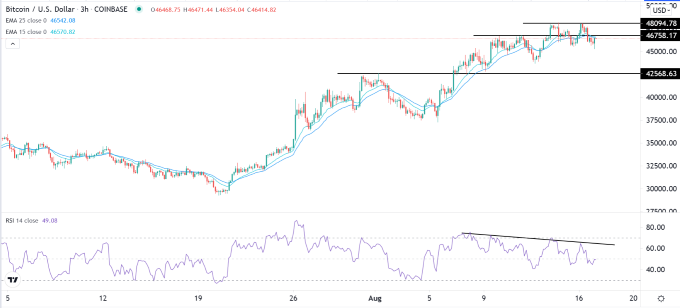
The three-hour chart shows that the BTC/USD pair formed a small double-top pattern at 48,095 this week. The neckline of this pattern was at 45,660. The pair also declined below the key support at 46,758, which was the highest point on 10th and 12th August.
The Bitcoin price has also moved below the 25-day and 15-day exponential moving averages. At the same time, the Relative Strength Index (RSI) and MACD have formed a bearish divergence pattern.
Therefore, the pair will likely see some short-term weakness as the strong rally takes a breather. If this happens, the next key levels to watch will be the support at 45,000 and the resistance at 48,000.

