Bearish view
- Sell the BTC/USD and add a take-profit at 40,000.
- Add a stop-loss at 46,760.
- Timeline: 1-2 days.
Bullish view
- Set a buy-stop at 46,760 and add a take-profit at 50,000.
- Add a stop-loss at 44,000.
The BTC/USD struggled during the overnight session as sentiment for cryptocurrencies reversed. Bitcoin declined to a weekly low of $44,420, which was substantially lower than the weekend high of more than $48,000.
Bitcoin Rally Fades
Bitcoin has been in a strong bullish rally in the past few weeks. After falling below $30,000 in July, the price managed to bounce back above $48,000 during this weekend.
There were several reasons behind this move. First, the decline below $30,000 saw it form major support. This, in turn, pushed more traders to believe that the price had formed a major bottom.
Second, Bitcoin price rallied after on-chain data showed that big holders were maintaining and even adding to their holdings. The most well-known big holders of Bitcoin are firms like Tesla, SpaceX, and MicroStrategy. These buyers maintained their holdings during the relentless crypto sell-off.
Meanwhile, the BTC/USD rose as more companies filed their Bitcoin Exchange-Traded Funds (ETF) with US regulators. This is after the current Securities and Exchange (SEC) chair said that the regulator will likely approve the funds if they focused on futures.
Therefore, there is a likelihood that an ETF will go live later this year. If that happens, investors will likely draw their funds from the relatively expensive Grayscale Bitcoin Trust to the funds. In most cases, ETFs tend to have a lower expense ratio.
Notably, the BTC/USD has jumped recently at a time when the US dollar has also gained. The US dollar index has risen by more than 1.40% from the lowest level in July as investors remain worried about the new Covid wave. The currency gained more on Tuesday after New Zealand announced its first case in six months.
BTC/USD Price Action
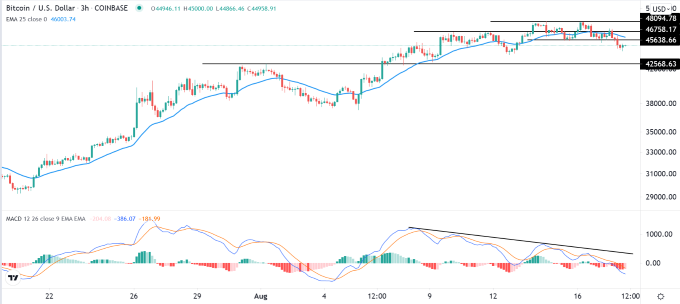
The three-hour chart shows that the BTC/USD pair has been in a strong bullish trend in the past few weeks. The pair then found a strong resistance at 48,094, where it formed a double-top pattern whose neckline was at 45,638.
The BTCUSD then declined below the 25-period and 50-period moving averages, which is a relatively bearish sign. The MACD and Relative Strength Index (RSI) shows that it has formed a bearish divergence pattern.
Therefore, the pair will likely maintain the bearish trend as bears target the next key support at 40,000. It will then resume the upward trend as bulls aim for the resistance at 50,000.

