Bullish view
- Set a buy-stop at 46,500 and a take-profit at 48,000.
- Add a stop-loss at 43,500.
- Timeline: 2 days.
Bearish view
- Set a sell-stop at 42,000 and a take-profit at 40,000.
- Add a stop-loss at 45,000.
The BTC/USD price is in a tight range as investors reflect on the recent impressive rally. The pair is trading at 44,659, which is significantly below this week’s high of 48,185. Its market capitalization stands at more than $830 billion.
Bitcoin Moving Sideways
The BTC/USD has barely moved in the past few days. Historically, Bitcoin prices tend to show low volatility after making a major upward move. This happens as investors reflect on the previous price action and others take profit.
Analysts are focusing on institutional flow into the cryptocurrency ecosystem. Recently, data filings with the Securities and Exchange Commission (SEC) show that many prominent hedge funds and big banks like Goldman Sachs and Citigroup hold shares in Coinbase. Coinbase is the second biggest cryptocurrencies exchange in the world after Binance. It is often seen as a proxy for Bitcoin.
Meanwhile, there is the overall sentiment that many large investors will also start allocating some of their funds to cryptocurrencies.
Some of these funds are likely waiting for more regulatory clarity about the ecosystem while others are waiting for Bitcoin Exchange Traded Funds (ETFs) to form. About 18 firms have already applied to launch these funds with the SEC and there is a possibility that they will get a leeway.
At the same time, data compiled by CoinMarketCap shows that the volume of Bitcoin traded every day has declined slightly recently. On Wednesday, exchanges processed Bitcoin trades worth more than $32 billion. This was significantly lower than last week’s high of more than $40 billion.
Bitcoin Price Forecast
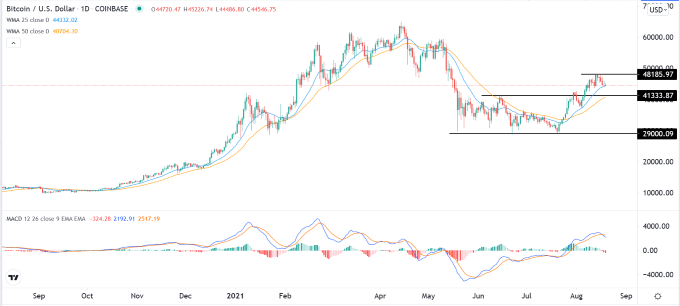
The daily chart shows that the BTC/USD strong rally hit a barrier this week. After soaring to more than $48,000 on Sunday, the price has retreated by about 4,000 to the current 44,610. Still, the pair’s bullish view is being supported by the 25-day and 50-day moving averages.
It has also moved above the key resistance level at 41,333, which was the highest level on June 15. The MACD remains above the neutral level but the two lines have made a bearish reversal. Therefore, the pair will likely remain at the current range and possibly break out higher on the next few days. If this happens, the next key reference level to watch is the psychological level at 50,000.

