Bullish View
Buy the BTC/USD and add a take-profit at 51,120 (61.8% retracement).
Add a stop-loss at 41,265.
Timeline: 1-3 days.
Bearish View
Set a sell-stop at 44,000 and a take-profit at 41,000.
Add a stop-loss at 48,000.
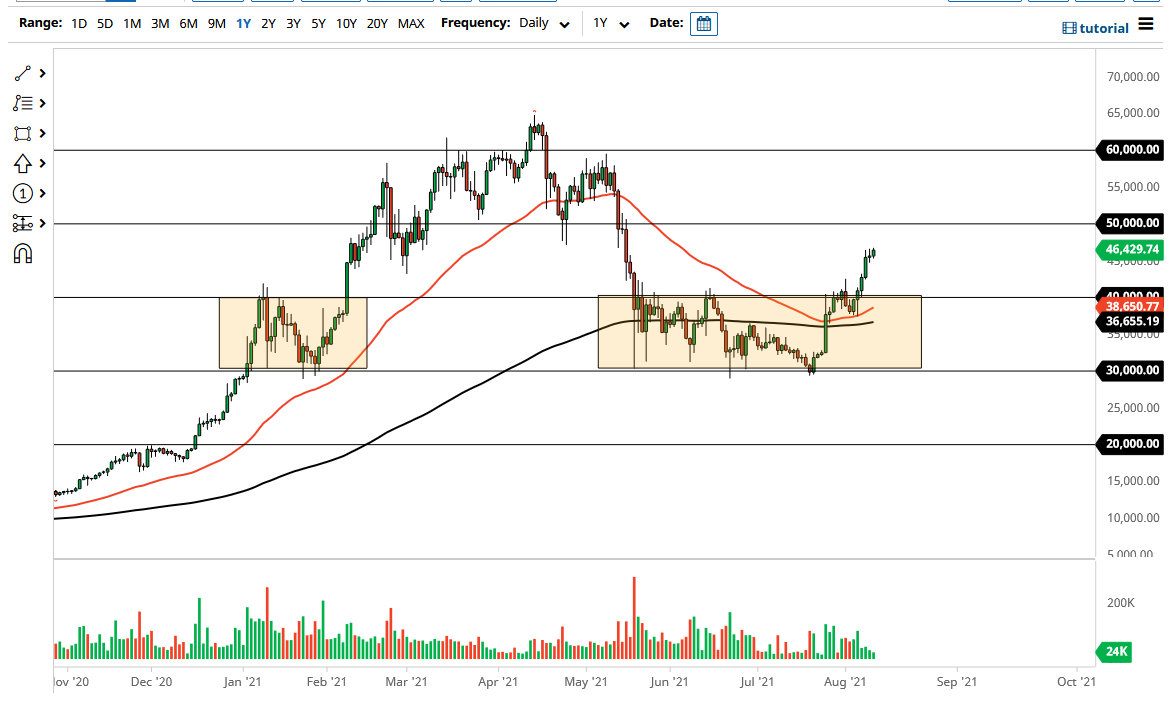
The BTC/USD price held steady close to its highest level since May 17 as demand for cryptocurrencies rose. The pair rose to 46,117, which was about 60% above the lowest level in July. This surge brings its total market capitalization to more than $810 billion.
Bitcoin and inflation
The BTC/USD rose slightly after the US dollar cooled down after the latest inflation data. The dollar index declined for the first day this week after data showed that the headline and core consumer price index was cooling. The CPI remained unchanged at 5.4% while the core CPI that excludes food and energy declined to 4.3%.
Inflation and employment numbers are important for Bitcoin prices because they have an impact on the Federal Reserve policies. With inflation set to fall further, there is a possibility that the Federal Reserve will maintain its dovish policies in the near term. The easy-money policies will likely provide more support to Bitcoin and other cryptocurrency prices.
Meanwhile, the BTC/USD rose after more companies expressed their support for the coin. For example, in a statement this week, AMC Entertainment, the biggest movies theatre chain in the US, said that it will start accepting the coin later this year. Tesla has also maintained its support for Bitcoin.
At the same time, more companies are filing their Bitcoin ETF applications. According to Bloomberg, about 18 companies have filed for Bitcoin funds with the SEC. The new trend came after the new SEC chair said that the agency will likely accept a Bitcoin futures ETF.
A Bitcoin ETF will provide institutional investors with a cheaper option to invest in the coin since the existing funds are relatively expensive. Indeed, this is probably the reason why data shows that outflows in existing Bitcoin funds have increased recently.
BTC/USD technical analysis
The daily chart shows that the BTC/USD price has been in a strong bullish trend recently. As a result, it has moved above the key resistance at 41,265, which was the highest level in July. It has also along the upper side of the Bollinger Bands and above the 25-day moving average.
The coin’s price is also approaching the 50% Fibonacci retracement level. Therefore, there is a possibility that the bullish trend will continue as bulls target the 61.8% retracement level at 51,150.


