Bearish View
Sell the BTC/USD and add a take-profit at 45,000.
Add a stop-loss at 48,500.
Timeline: 1-2 days.
Bullish View
Set a buy-stop at 48,500.
Add a take-profit at 50,000 and a stop-loss at 47,000.
The BTC/USD recent bullish momentum faded as bulls struggled pushing it above the 50,000 mark. Bitcoin is trading at 46,982, which is substantially lower than last week’s high of more than 50,000. Its total market cap has dropped to more than $880 billion.
Bitcoin Struggle Continues
Bitcoin was in a spectacular rally early this month as investors rushed to buy the dips. This rally started fading last week after the coin jumped above $50,000 for the first time since May. The decline was mostly because of technical reasons. Besides, the price had jumped by more than $20,000 within a few weeks. As such, some buyers were starting to exit their trades. Also, in most periods, Bitcoin tends to find some weakness after hitting a major resistance level.
The current weakness accelerated after the recent Jerome Powell’s speech at the virtual Jackson Hole Summit. In it, he said that the bank could start tightening market conditions later this year so long as the economic recovery remained. As such, some investors are worried about the performance of cryptocurrencies when the Fed starts a tightening process.
Meanwhile, the BTC/USD is struggling as investors reflect on a statement by billionaire John Poulson. In an interview by fellow billionaire David Rubenstein, he warned that Bitcoin and the cryptocurrency industry was a massive bubble that will likely burst over time.
This was a notable statement since Poulson is known for making more than $20 billion when the housing market bubble burst. Still, in the past decade, Bitcoin has outperformed gold, which is one of Poulson’s biggest holdings.
The BTC/USD is also struggling after protests happened in El Salvador as the parliament passed the Bitcoin bill. The residents are worried that adopting the cryptocurrency could lead to more corruption.
BTC/USD Forecast
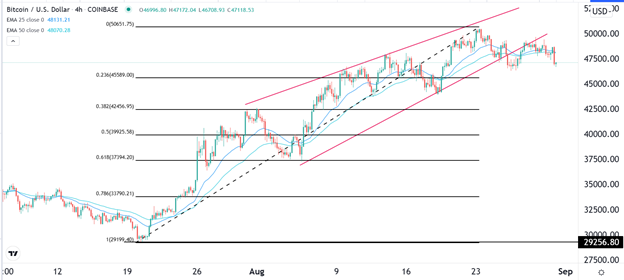
The four-hour chart shows that the BTC/USD price broke out lower last week after it formed a rising wedge pattern. The price dropped from slightly above 50,000 to about 46,300. It then rose and moved close to the lower side of this wedge, in what is known as a break and retest approach. Additionally, the pair has dropped below the 25-day and 50-day moving average. It is also slightly above the 23.6% Fibonacci retracement level. Therefore, the pair will likely maintain a bearish trend as bears target the key support at 45,590.

