Bullish View
Buy the BTC/USD and add a take-profit at 50,000.
Add a stop-loss at 41,265.
Timeline: 1-2 days.
Bearish View
Set a sell-stop at 44,000 and a take-profit at 41,000.
Add a stop-loss at 47,000.
The BTC/USD remained in a tight range after the strong Coinbase earnings and the infrastructure bill that was passed by the American Senate. Bitcoin is trading at $45,915, which is slightly below this week’s high of $46,670.
Coinbase Earnings
Coinbase is the world’s second-biggest cryptocurrencies exchange after Binance. The company has a market capitalization of more than $56 billion, which is still about 30% below its all-time high. In a statement on Tuesday, the company said that its revenue jumped to more than $2.23 billion while its earnings rose to $3.45 per share.
The two figures were stronger than what Wall Street analysts were expecting. By segment, the firm made $1.9 billion in transaction revenue or commissions it charges for trades and $100 million from its subscription services. Its monthly transacting number of users rose by 44% to 8.8 million in the second quarter while its trading volume rose to $462 billion. Still, the firm predicted that its growth will start slowing down this quarter.
The BTC/USD also held steady after a major hack affected a Binance Chain-developed project. In a statement, Poly Network said that hackers managed to steal cryptocurrencies worth $600 million, in one of the biggest hacks of all time. The other biggest cryptocurrency heists include the Coincheck and Mt Gox hacks. This hack will possibly raise the issue of regulations in the cryptocurrency industry.
Meanwhile, the Bitcoin price was little changed after the US Senate voted to pass the $1 trillion infrastructure bill. The bill will see the US build more projects like roads, rail, and bridges. Also, the debate highlighted that some key Senators supported cryptocurrencies. An amendment to redefine the term broker failed in the Senate. Looking ahead, the pair will react to the latest US Consumer Price Index (CPI) data.
BTC/USD Technical Analysis
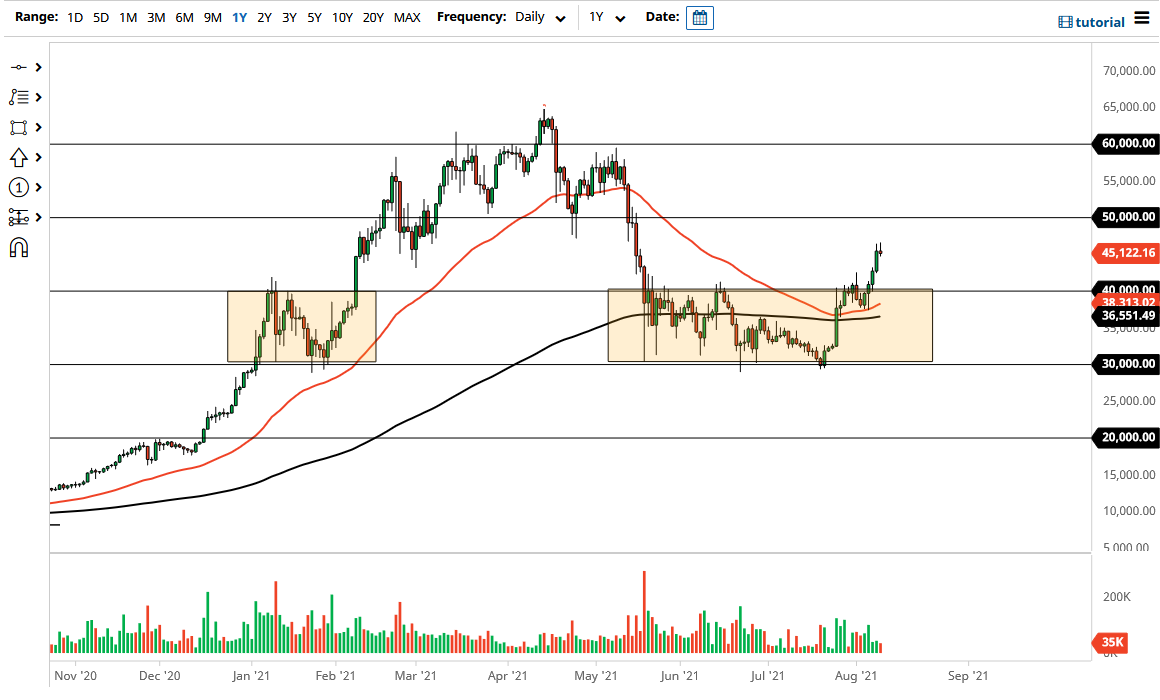
The daily chart shows that the BTC/USD pair has been in a bullish trend lately. The pair managed to move above the key resistance level at 41,265, which was the highest level on June 15. It also rose above the 25-day and 50-day moving averages while the Relative Strength Index (RSI) has moved to the overbought level of 70.
Therefore, the pair will likely maintain the bullish momentum as bulls attempt to recapture moves above 50,000. This will likely depend on the US CPI data. Still, a move below 41,265 will invalidate this view.

